Philips 2010 Annual Report Download - page 174
Download and view the complete annual report
Please find page 174 of the 2010 Philips annual report below. You can navigate through the pages in the report by either clicking on the pages listed below, or by using the keyword search tool below to find specific information within the annual report.-
 1
1 -
2
-
3
-
4
-
5
-
6
-
7
-
8
-
9
-
10
-
11
-
12
-
13
-
14
-
15
-
16
-
17
-
18
-
19
-
20
-
21
-
22
-
23
-
24
-
25
-
26
-
27
-
28
-
29
-
30
-
31
-
32
-
33
-
34
-
35
-
36
-
37
-
38
-
39
-
40
-
41
-
42
-
43
-
44
-
45
-
46
-
47
-
48
-
49
-
50
-
51
-
52
-
53
-
54
-
55
-
56
-
57
-
58
-
59
-
60
-
61
-
62
-
63
-
64
-
65
-
66
-
67
-
68
-
69
-
70
-
71
-
72
-
73
-
74
-
75
-
76
-
77
-
78
-
79
-
80
-
81
-
82
-
83
-
84
-
85
-
86
-
87
-
88
-
89
-
90
-
91
-
92
-
93
-
94
-
95
-
96
-
97
-
98
-
99
-
100
-
101
-
102
-
103
-
104
-
105
-
106
-
107
-
108
-
109
-
110
-
111
-
112
-
113
-
114
-
115
-
116
-
117
-
118
-
119
-
120
-
121
-
122
-
123
-
124
-
125
-
126
-
127
-
128
-
129
-
130
-
131
-
132
-
133
-
134
-
135
-
136
-
137
-
138
-
139
-
140
-
141
-
142
-
143
-
144
-
145
-
146
-
147
-
148
-
149
-
150
-
151
-
152
-
153
-
154
-
155
-
156
-
157
-
158
-
159
-
160
-
161
-
162
-
163
-
 164
164 -
 165
165 -
 166
166 -
 167
167 -
 168
168 -
 169
169 -
 170
170 -
 171
171 -
 172
172 -
 173
173 -
 174
174 -
 175
175 -
 176
176 -
 177
177 -
 178
178 -
 179
179 -
 180
180 -
 181
181 -
 182
182 -
 183
183 -
 184
184 -
185
-
186
-
187
-
188
-
189
-
190
-
191
-
192
-
193
-
194
-
195
-
196
-
197
-
198
-
199
-
200
-
201
-
202
-
203
-
204
-
205
-
206
-
207
-
208
-
209
-
210
-
211
-
212
-
213
-
214
-
215
-
216
-
217
-
218
-
219
-
220
-
221
-
222
-
223
-
224
-
225
-
226
-
227
-
228
-
229
-
230
-
231
-
232
-
233
-
234
-
235
-
236
-
237
-
238
-
239
-
240
-
241
-
242
-
243
-
244
-
245
-
246
-
247
-
248
-
249
-
250
 |
 |
10 11 13 Group financial statements 13.11 - 13.11
174 Annual Report 2010
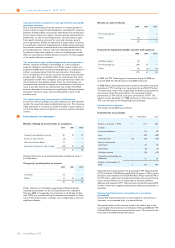
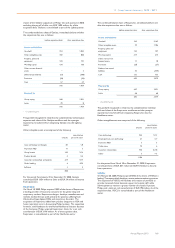
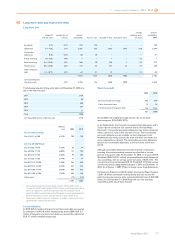
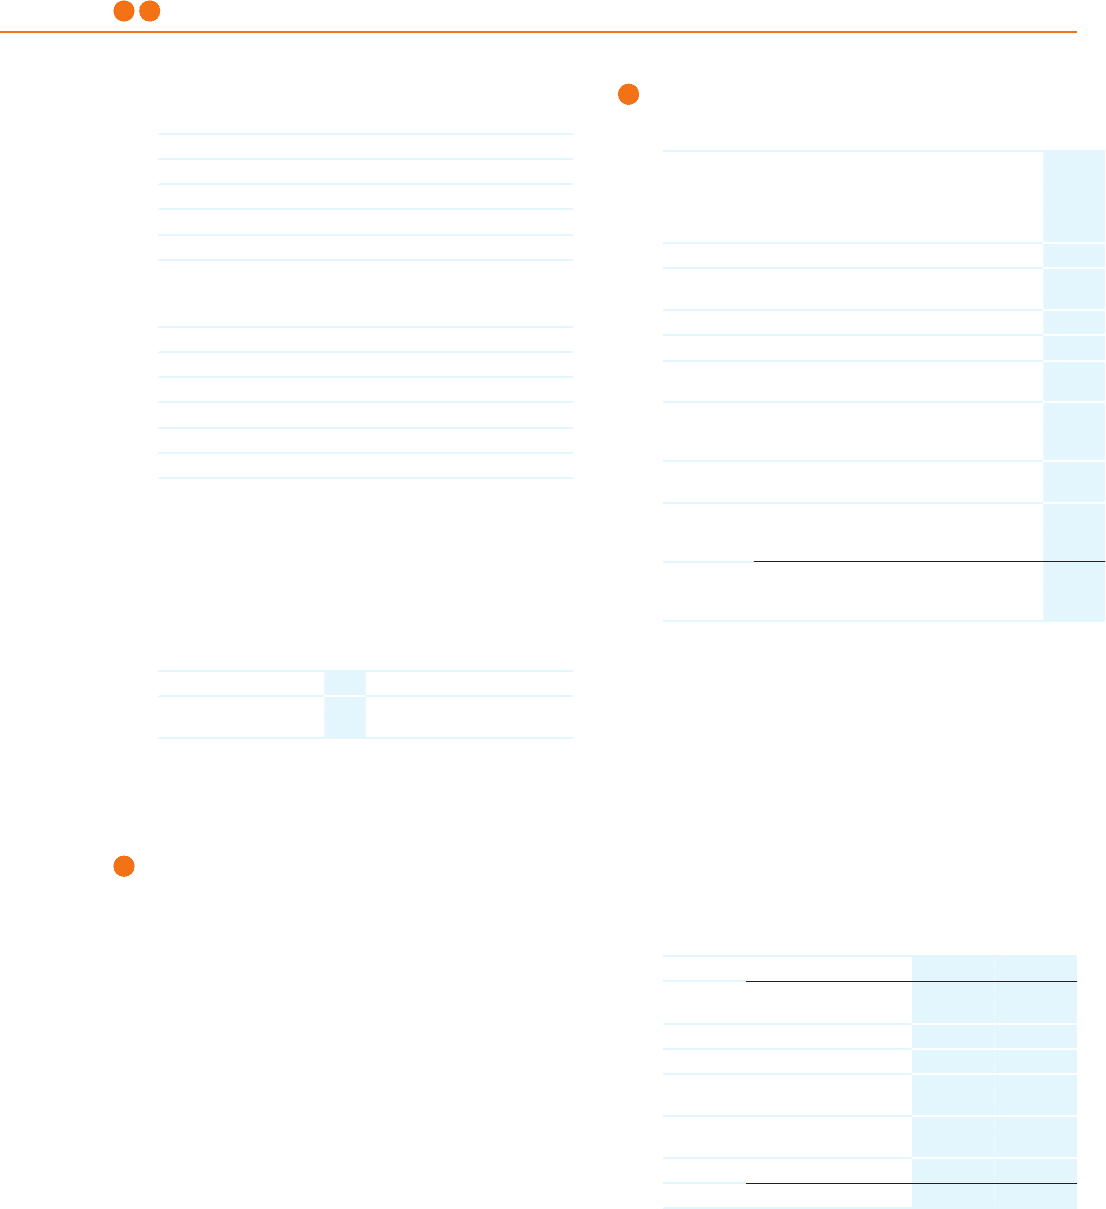
The estimated amortization expense for other intangible assets for each
of the next five years are:
2011 471
2012 426
2013 384
2014 309
2015 293
The expected useful lives of the intangible assets excluding goodwill are
as follows:
Brand names 2-20 years
Customer relationships 2-25 years
Technology 3-20 years
Other 1-8 years
Software 3 years
Development 3-5 years
The expected weighted average remaining life of other intangible assets
is 9.1 years as of December 31, 2010 (2009: 11.3 years).
The Group assessed the useful life of intangible assets with indefinite
lives and reviewed the amortization period for intangible assets with
definite lives. This assessment resulted in the following changes in
amortization expense, mainly recognized in cost of sales, for 2010 and
future years:
in thousands of euros
2010 2011 2012 2013 2014 later
Increase in amortization
expense 16 15 15 15 15 196
The unamortized costs of computer software to be sold, leased or
otherwise marketed amounted to EUR 82 million (2009: EUR 95
million). The amounts charged to the Consolidated statements of
income for amortization or impairment of these capitalized computer
software costs amounted to EUR 25 million (2009: EUR 38 million).
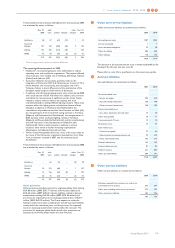
10 Non-current receivables
Non-current receivables include receivables with a remaining term of
more than one year, and the non-current portion of income taxes
receivable amounting to EUR 2 million (2009: EUR 2 million).
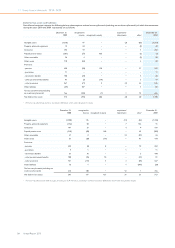
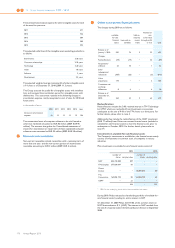
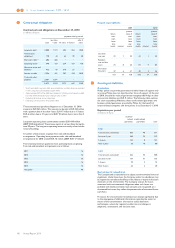
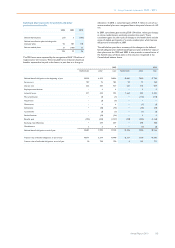
11 Other non-current financial assets
The changes during 2010 are as follows:
available-
for-sale
financial
assets loans and re-
ceivables
held-to-
maturity
invest-
ments
financial as-
sets
at fair value
through profit
or loss total
Balance as of
January 1, 2010 581 76 2 32 691
Changes:
Reclassifications (44) (17) − 22 (39)
Acquisitions/
additions 25 10 − 1 36
Sales/
redemptions/
reductions (387) (22) − (2) (411)
Value
adjustments 179 − − 5 184
Translation and
exchange
differences 8 6 − 4 18
Balance as of
December 31,
2010 362 53 2 62 479
Reclassifications
Reclassifications include the 3.0% retained interest in TPV Technology
Ltd (TPV) which was reclassified from Investments in associates
subsequent to the sale of 9.4% of the TPV shares to a third party. For
further details, please refer to note 4.
Additionally they include the reclassification of the CBAY investment
(EUR 77 million) from Other non-current financial assets (included in
available-for-sale financial assets) to Current financial assets prior to
redemption in October, 2010. For further details, please refer to
note 14.
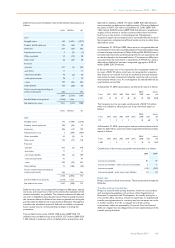
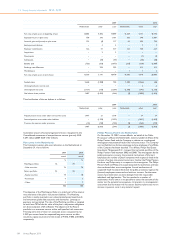
Investments in available-for-sale financial assets
The Company’s investments in available-for-sale financial assets mainly
consists of investments in common stock of companies in various
industries.
Main investments in available-for-sale financial assets consist of:
2009 2010
number of
shares carrying value number of
shares carrying value
NXP 854,313,000 207 − −
TPO Displays 677,839,047 81 − −
Chimei
Innolux − − 85,891,073 89
TCL
Corporation 162,855,739 85 162,855,739 63
CBAY1) − 61 − −
434 − 152
1) CBAY is the underlying bond within the convertible instrument
During 2010, Philips reduced its shareholding portfolio of available-for-
sale financial assets by selling its entire interest in NXP.
On December 31, 2009 Philips held 19.8% of the common shares in
NXP Semiconductors B.V. (NXP). The interest in NXP resulted from
the sale of a majority stake in the Semiconductors division in September
2006.