Philips 2010 Annual Report Download - page 61
Download and view the complete annual report
Please find page 61 of the 2010 Philips annual report below. You can navigate through the pages in the report by either clicking on the pages listed below, or by using the keyword search tool below to find specific information within the annual report.-
 1
1 -
2
-
3
-
4
-
5
-
6
-
7
-
8
-
9
-
10
-
11
-
12
-
13
-
14
-
15
-
16
-
17
-
18
-
19
-
20
-
21
-
22
-
23
-
24
-
25
-
26
-
27
-
28
-
29
-
30
-
31
-
32
-
33
-
34
-
35
-
36
-
37
-
38
-
39
-
40
-
41
-
42
-
43
-
44
-
45
-
46
-
47
-
48
-
49
-
50
-
 51
51 -
 52
52 -
 53
53 -
 54
54 -
 55
55 -
 56
56 -
 57
57 -
 58
58 -
 59
59 -
 60
60 -
 61
61 -
 62
62 -
 63
63 -
 64
64 -
 65
65 -
 66
66 -
 67
67 -
 68
68 -
 69
69 -
 70
70 -
 71
71 -
72
-
73
-
74
-
75
-
76
-
77
-
78
-
79
-
80
-
81
-
82
-
83
-
84
-
85
-
86
-
87
-
88
-
89
-
90
-
91
-
92
-
93
-
94
-
95
-
96
-
97
-
98
-
99
-
100
-
101
-
102
-
103
-
104
-
105
-
106
-
107
-
108
-
109
-
110
-
111
-
112
-
113
-
114
-
115
-
116
-
117
-
118
-
119
-
120
-
121
-
122
-
123
-
124
-
125
-
126
-
127
-
128
-
129
-
130
-
131
-
132
-
133
-
134
-
135
-
136
-
137
-
138
-
139
-
140
-
141
-
142
-
143
-
144
-
145
-
146
-
147
-
148
-
149
-
150
-
151
-
152
-
153
-
154
-
155
-
156
-
157
-
158
-
159
-
160
-
161
-
162
-
163
-
164
-
165
-
166
-
167
-
168
-
169
-
170
-
171
-
172
-
173
-
174
-
175
-
176
-
177
-
178
-
179
-
180
-
181
-
182
-
183
-
184
-
185
-
186
-
187
-
188
-
189
-
190
-
191
-
192
-
193
-
194
-
195
-
196
-
197
-
198
-
199
-
200
-
201
-
202
-
203
-
204
-
205
-
206
-
207
-
208
-
209
-
210
-
211
-
212
-
213
-
214
-
215
-
216
-
217
-
218
-
219
-
220
-
221
-
222
-
223
-
224
-
225
-
226
-
227
-
228
-
229
-
230
-
231
-
232
-
233
-
234
-
235
-
236
-
237
-
238
-
239
-
240
-
241
-
242
-
243
-
244
-
245
-
246
-
247
-
248
-
249
-
250
 |
 |

5 Group performance 5.1.2 - 5.1.3
Annual Report 2010 61
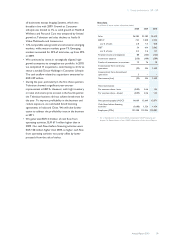
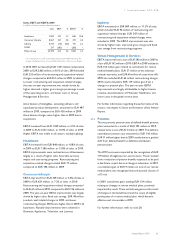
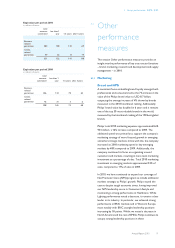
Sales, EBIT and EBITA 2009
in millions of euros unless otherwise stated
sales EBIT1) % EBITA1) %
Healthcare 7,839 591 7.5 848 10.8
Consumer Lifestyle 8,467 321 3.8 339 4.0
Lighting 6,546 (16) (0.2) 145 2.2
GM&S 337 (282) − (282) −
Philips Group 23,189 614 2.6 1,050 4.5
1) For a reconciliation to the most directly comparable GAAP measures, see
chapter 16, Reconciliation of non-GAAP information, of this Annual Report
In 2010, EBIT increased by EUR 1,451 million compared to
2009, to EUR 2,065 million, or 8.1% of sales. 2010 included
EUR 233 million of restructuring and acquisition-related
charges, compared to EUR 551 million in 2009. In addition
to lower restructuring and acquisition-related charges,
the year-on-year improvement was mainly driven by
higher sales and a higher gross margin percentage in each
of the operating sectors, and lower costs in Group
Management & Services.
Amortization of intangibles, excluding software and
capitalized product development, amounted to EUR 487
million in 2010, compared to EUR 436 million in 2009.
Amortization charges were higher than in 2009 due to
acquisitions.
EBITA increased from EUR 1,050 million, or 4.5% of sales,
in 2009 to EUR 2,552 million, or 10.0% of sales, in 2010.
Higher EBITA was visible in all sectors, notably Lighting.
Healthcare
EBITA increased from EUR 848 million, or 10.8% of sales,
in 2009 to EUR 1,186 million, or 13.8% of sales, in 2010.
EBITA improvements were realized across all businesses,
largely as a result of higher sales, favorable currency
impact and cost-saving programs. Restructuring and
acquisition-related charges totaled EUR 77 million,
compared to EUR 106 million in 2009.
Consumer Lifestyle
EBITA improved from EUR 339 million, or 4.0% of sales, in
2009 to EUR 639 million, or 7.2% of sales, in 2010.
Restructuring and acquisition-related charges amounted
to EUR 61 million in 2010, compared to EUR 136 million in
2009. The year-on-year EBITA improvement was largely
driven by higher sales, fixed cost savings, EUR 48 million
product recall related charges in 2009, and lower
restructuring charges. EBITA was higher than in 2009 in all
businesses. Notable improvements were achieved in
Domestic Appliances, Television, and Licenses.
Lighting
EBITA amounted to EUR 869 million, or 11.5% of sales,
which included EUR 96 million of restructuring and
acquisition-related charges. EUR 247 million of
restructuring and acquisition-related charges were
included in 2009. The EBITA improvement was also
driven by higher sales, improved gross margin and fixed
cost savings from restructuring programs.
Group Management & Services
EBITA improved from a loss of EUR 282 million in 2009 to
a loss of EUR 142 million in 2010. EBITA in 2009 included a
EUR 134 million gain related to curtailment for retiree
medical benefit plans, EUR 57 million of net asbestos-
related recoveries, and EUR 46 million of asset write-offs.
2009 also included EUR 63 million restructuring charges.
2010 results included a EUR 119 million gain from a
change in a pension plan. The year-on-year EBITA
improvement was largely attributable to higher license
revenue, discontinuation of Molecular Healthcare, and
lower costs in the global service units.
For further information regarding the performance of the
sectors, see chapter 6, Sector performance, of this Annual
Report.
5.1.3 Pensions
The net periodic pension costs of defined-benefit pension
plans amounted to a credit of EUR 103 million in 2010,
compared to a cost of EUR 3 million in 2009. The defined-
contribution pension cost amounted to EUR 118 million,
EUR 11 million higher than in 2009, mainly due to a gradual
shift from defined-benefit to defined-contribution
pension plans.
The 2010 costs were impacted by the recognition of EUR
119 million of negative prior-service costs. These resulted
from a reduction of pension benefits expected to be paid
in the future, in part due to a change in indexation. In 2010,
a curtailment gain of EUR 9 million on one of our retiree
medical plans was recognized due to the partial closure of
a US site.
In 2009, curtailment gains totaling EUR 134 million,
relating to changes in retiree medical plans, positively
impacted the result. These curtailment gains are the result
of changes in the benefit level and the scope of eligible
participants of a retiree medical plan, which became
effective and irreversible in 2009.
For further information, refer to note 28.