Philips 2010 Annual Report Download - page 4
Download and view the complete annual report
Please find page 4 of the 2010 Philips annual report below. You can navigate through the pages in the report by either clicking on the pages listed below, or by using the keyword search tool below to find specific information within the annual report.-
 1
1 -
 2
2 -
 3
3 -
 4
4 -
 5
5 -
 6
6 -
 7
7 -
 8
8 -
 9
9 -
 10
10 -
 11
11 -
 12
12 -
 13
13 -
 14
14 -
 15
15 -
16
-
17
-
18
-
19
-
20
-
21
-
22
-
23
-
24
-
25
-
26
-
27
-
28
-
29
-
30
-
31
-
32
-
33
-
34
-
35
-
36
-
37
-
38
-
39
-
40
-
41
-
42
-
43
-
44
-
45
-
46
-
47
-
48
-
49
-
50
-
51
-
52
-
53
-
54
-
55
-
56
-
57
-
58
-
59
-
60
-
61
-
62
-
63
-
64
-
65
-
66
-
67
-
68
-
69
-
70
-
71
-
72
-
73
-
74
-
75
-
76
-
77
-
78
-
79
-
80
-
81
-
82
-
83
-
84
-
85
-
86
-
87
-
88
-
89
-
90
-
91
-
92
-
93
-
94
-
95
-
96
-
97
-
98
-
99
-
100
-
101
-
102
-
103
-
104
-
105
-
106
-
107
-
108
-
109
-
110
-
111
-
112
-
113
-
114
-
115
-
116
-
117
-
118
-
119
-
120
-
121
-
122
-
123
-
124
-
125
-
126
-
127
-
128
-
129
-
130
-
131
-
132
-
133
-
134
-
135
-
136
-
137
-
138
-
139
-
140
-
141
-
142
-
143
-
144
-
145
-
146
-
147
-
148
-
149
-
150
-
151
-
152
-
153
-
154
-
155
-
156
-
157
-
158
-
159
-
160
-
161
-
162
-
163
-
164
-
165
-
166
-
167
-
168
-
169
-
170
-
171
-
172
-
173
-
174
-
175
-
176
-
177
-
178
-
179
-
180
-
181
-
182
-
183
-
184
-
185
-
186
-
187
-
188
-
189
-
190
-
191
-
192
-
193
-
194
-
195
-
196
-
197
-
198
-
199
-
200
-
201
-
202
-
203
-
204
-
205
-
206
-
207
-
208
-
209
-
210
-
211
-
212
-
213
-
214
-
215
-
216
-
217
-
218
-
219
-
220
-
221
-
222
-
223
-
224
-
225
-
226
-
227
-
228
-
229
-
230
-
231
-
232
-
233
-
234
-
235
-
236
-
237
-
238
-
239
-
240
-
241
-
242
-
243
-
244
-
245
-
246
-
247
-
248
-
249
-
250
 |
 |

Performance highlights
4 Annual Report 2010
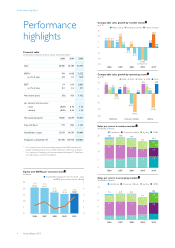
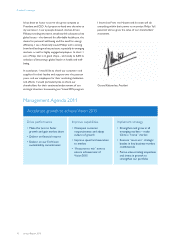
Performance
highlights
Financial table
all amounts in millions of euros unless otherwise stated
2008 2009 2010
Sales 26,385 23,189 25,419
EBITA1) 744 1,050 2,552
as a % of sales 2.8 4.5 10.0
EBIT1) 54 614 2,065
as a % of sales 0.2 2.6 8.1
Net income (loss) (92) 424 1,452
per common share in euros
- basic (0.09) 0.46 1.54
- diluted (0.09) 0.46 1.53
Net operating capital1) 14,069 12,649 12,071
Free cash flows1) 773 863 1,333
Shareholders’ equity 15,544 14,595 15,046
Employees at December 31 121,398 115,924 119,001
1) For a reconciliation to the most directly comparable GAAP measures, see
chapter 16, Reconciliation of non-GAAP information, of this Annual Report
2) For a definition of emerging and mature markets, see chapter 19, Definitions
and abbreviations, of this Annual Report
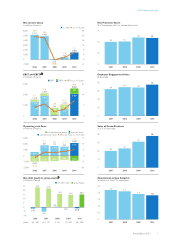
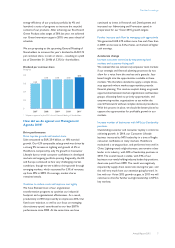
Equity and EBITA per common share1)
in euros ■-shareholders’ equity per common share - basic
--EBITA per common share - diluted
25
20
15
10
5
0
5
4
3
2
1
0
1.29
20.87
2006
1.91
20.41
2007
0.75
16.84
2008
1.13
15.74
2009
2.69
15.89
2010
Comparable sales growth by market cluster1)
as a % ■-Philips Group--■-emerging markets--■-mature markets
15
10
5
0
(5)
(10)
(15)
6.4 6.5 6.3
2006
4.9
10.2
2.8
2007
(2.7)
3.5
(5.4)
2008
(11.4)
(10.8)
(11.7)
2009
4.3
11.9
0.9
2010
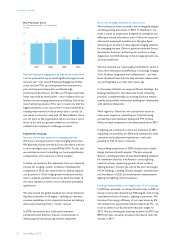
Comparable sales growth by operating sector1)
as a % ■-2006--■-2007--■-2008--■-2009--■-2010
10
4
(2)
(8)
(14)
(20)
8.2
3.7 5.6
(2.7)
3.9
Healthcare
6.3
3.5
(8.9)
(16.5)
1.2
Consumer Lifestyle
8.8 6.5
3.1
(12.6)
8.7
Lighting
Sales per sector in mature markets2)
in billions of euros
■-Healthcare--■-Consumer Lifestyle--■-Lighting--■-GM&S
20
15
10
5
0
2006
5.5
8.5
3.71.1
18.8
2007
5.5
8.7
4.10.5
18.8
2008
6.4
6.7
5.00.3
18.4
2009
6.4
5.4
4.30.2
16.3
2010
6.9
5.3
4.70.2
17.1
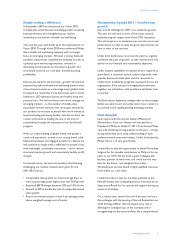
Sales per sector in emerging markets2)
in billions of euros
■-Healthcare--■-Consumer Lifestyle --■-Lighting--■-GM&S
10
8
6
4
2
0
2006
1.1
4.4
2.00.4
7.9
2007
1.1
4.5
2.20.2
8.0
2008
1.2
4.2
2.40.2
8.0
2009
1.5
3.1
2.20.1
6.9
2010
1.7
3.6
2.90.1
8.3