Philips 2010 Annual Report Download - page 148
Download and view the complete annual report
Please find page 148 of the 2010 Philips annual report below. You can navigate through the pages in the report by either clicking on the pages listed below, or by using the keyword search tool below to find specific information within the annual report.-
 1
1 -
2
-
3
-
4
-
5
-
6
-
7
-
8
-
9
-
10
-
11
-
12
-
13
-
14
-
15
-
16
-
17
-
18
-
19
-
20
-
21
-
22
-
23
-
24
-
25
-
26
-
27
-
28
-
29
-
30
-
31
-
32
-
33
-
34
-
35
-
36
-
37
-
38
-
39
-
40
-
41
-
42
-
43
-
44
-
45
-
46
-
47
-
48
-
49
-
50
-
51
-
52
-
53
-
54
-
55
-
56
-
57
-
58
-
59
-
60
-
61
-
62
-
63
-
64
-
65
-
66
-
67
-
68
-
69
-
70
-
71
-
72
-
73
-
74
-
75
-
76
-
77
-
78
-
79
-
80
-
81
-
82
-
83
-
84
-
85
-
86
-
87
-
88
-
89
-
90
-
91
-
92
-
93
-
94
-
95
-
96
-
97
-
98
-
99
-
100
-
101
-
102
-
103
-
104
-
105
-
106
-
107
-
108
-
109
-
110
-
111
-
112
-
113
-
114
-
115
-
116
-
117
-
118
-
119
-
120
-
121
-
122
-
123
-
124
-
125
-
126
-
127
-
128
-
129
-
130
-
131
-
132
-
133
-
134
-
135
-
136
-
137
-
 138
138 -
 139
139 -
 140
140 -
 141
141 -
 142
142 -
 143
143 -
 144
144 -
 145
145 -
 146
146 -
 147
147 -
 148
148 -
 149
149 -
 150
150 -
 151
151 -
 152
152 -
 153
153 -
 154
154 -
 155
155 -
 156
156 -
 157
157 -
 158
158 -
159
-
160
-
161
-
162
-
163
-
164
-
165
-
166
-
167
-
168
-
169
-
170
-
171
-
172
-
173
-
174
-
175
-
176
-
177
-
178
-
179
-
180
-
181
-
182
-
183
-
184
-
185
-
186
-
187
-
188
-
189
-
190
-
191
-
192
-
193
-
194
-
195
-
196
-
197
-
198
-
199
-
200
-
201
-
202
-
203
-
204
-
205
-
206
-
207
-
208
-
209
-
210
-
211
-
212
-
213
-
214
-
215
-
216
-
217
-
218
-
219
-
220
-
221
-
222
-
223
-
224
-
225
-
226
-
227
-
228
-
229
-
230
-
231
-
232
-
233
-
234
-
235
-
236
-
237
-
238
-
239
-
240
-
241
-
242
-
243
-
244
-
245
-
246
-
247
-
248
-
249
-
250
 |
 |

13 Group financial statements 13.7 - 13.7
148 Annual Report 2010
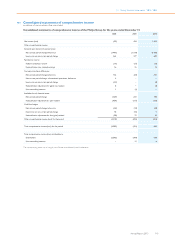
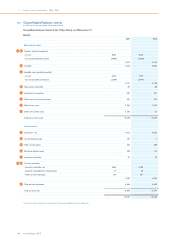
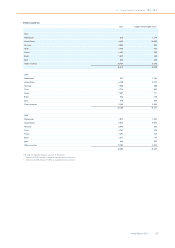
13.7 Consolidated statements of cash flows
in millions of euros
Consolidated statements of cash flows of the Philips Group for the years ended December 31
2008 2009 2010
Cash flows from operating activities
Net (loss) income (92) 424 1,452
Income from discontinued operations (3) − −
Adjustments to reconcile net income (loss) to net cash provided by operating activities:
Depreciation and amortization 1,528 1,469 1,422
Impairment of goodwill, other non-current financial assets and investments in associates 1,509 2 5
Net gain on sale of assets (1,536) (140) (211)
Income from investments in associates (91) (23) (18)
Dividends received from investments in associates 65 35 19
Dividends paid to non-controlling interests (2) (4) (4)
Decrease (increase) in receivables and other current assets 234 496 (194)
(Increase) decrease in inventories (9) 687 (705)
(Decrease) increase in accounts payable and accrued and other current liabilities (97) (479) 915
(Increase) in non-current receivables, other assets and other liabilities (379) (363) (291)
Increase (decrease) in provisions 432 (612) (237)
Other items 89 53 3
Net cash provided by operating activities 1,648 1,545 2,156
Cash flows from investing activities
Purchase of intangible assets (121) (96) (80)
Expenditures on development assets (154) (188) (219)
Capital expenditures on property, plant and equipment (770) (524) (653)
Proceeds from disposals of property, plant and equipment 170 126 129
Cash from (used for) derivatives and securities
25 337 (39) (25)
Purchase of other non-current financial assets − (6) (16)
Proceeds from other non-current financial assets
26 2,576 718 268
Purchase of businesses, net of cash acquired (5,316) (294) (223)
Proceeds from sale of interests in businesses, net of cash disposed of 24 84 117
Net cash used for investing activities (3,254) (219) (702)
Cash flows from financing activities
Proceeds from issuance of (payments on) short-term debt 18 (201) 143
Principal payments on short-term portion of long-term debt (1,726) (51) (79)
Proceeds from issuance of long-term debt 2,088 312 71
Treasury shares transaction (3,257) 29 65
Dividends paid (698) (634) (296)
Net cash used for financing activities (3,575) (545) (96)
Net cash (used for) provided by continuing operations (5,181) 781 1,358