Philips 2010 Annual Report Download - page 92
Download and view the complete annual report
Please find page 92 of the 2010 Philips annual report below. You can navigate through the pages in the report by either clicking on the pages listed below, or by using the keyword search tool below to find specific information within the annual report.-
 1
1 -
2
-
3
-
4
-
5
-
6
-
7
-
8
-
9
-
10
-
11
-
12
-
13
-
14
-
15
-
16
-
17
-
18
-
19
-
20
-
21
-
22
-
23
-
24
-
25
-
26
-
27
-
28
-
29
-
30
-
31
-
32
-
33
-
34
-
35
-
36
-
37
-
38
-
39
-
40
-
41
-
42
-
43
-
44
-
45
-
46
-
47
-
48
-
49
-
50
-
51
-
52
-
53
-
54
-
55
-
56
-
57
-
58
-
59
-
60
-
61
-
62
-
63
-
64
-
65
-
66
-
67
-
68
-
69
-
70
-
71
-
72
-
73
-
74
-
75
-
76
-
77
-
78
-
79
-
80
-
81
-
 82
82 -
 83
83 -
 84
84 -
 85
85 -
 86
86 -
 87
87 -
 88
88 -
 89
89 -
 90
90 -
 91
91 -
 92
92 -
 93
93 -
 94
94 -
 95
95 -
 96
96 -
 97
97 -
 98
98 -
 99
99 -
 100
100 -
 101
101 -
 102
102 -
103
-
104
-
105
-
106
-
107
-
108
-
109
-
110
-
111
-
112
-
113
-
114
-
115
-
116
-
117
-
118
-
119
-
120
-
121
-
122
-
123
-
124
-
125
-
126
-
127
-
128
-
129
-
130
-
131
-
132
-
133
-
134
-
135
-
136
-
137
-
138
-
139
-
140
-
141
-
142
-
143
-
144
-
145
-
146
-
147
-
148
-
149
-
150
-
151
-
152
-
153
-
154
-
155
-
156
-
157
-
158
-
159
-
160
-
161
-
162
-
163
-
164
-
165
-
166
-
167
-
168
-
169
-
170
-
171
-
172
-
173
-
174
-
175
-
176
-
177
-
178
-
179
-
180
-
181
-
182
-
183
-
184
-
185
-
186
-
187
-
188
-
189
-
190
-
191
-
192
-
193
-
194
-
195
-
196
-
197
-
198
-
199
-
200
-
201
-
202
-
203
-
204
-
205
-
206
-
207
-
208
-
209
-
210
-
211
-
212
-
213
-
214
-
215
-
216
-
217
-
218
-
219
-
220
-
221
-
222
-
223
-
224
-
225
-
226
-
227
-
228
-
229
-
230
-
231
-
232
-
233
-
234
-
235
-
236
-
237
-
238
-
239
-
240
-
241
-
242
-
243
-
244
-
245
-
246
-
247
-
248
-
249
-
250
 |
 |

6 Sector performance 6.2.4 - 6.2.5
92 Annual Report 2010
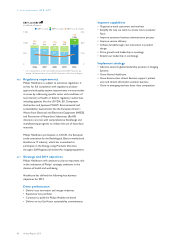
Implement strategy
•Grow Health & Wellness: The Health & Wellness
business grew in every quarter of 2010. The acquisition
of Discus Holdings expands our oral healthcare
portfolio and creates synergies with the established
dental professional relationships we have through
Philips Sonicare. We continue to focus on marketing
innovation and expansion in emerging markets to
capture this large growth opportunity.
•Manage TV to profitability: We successfully extended our
brand licensing partnerships with Videocon (India) and
TPV (China). We continued to reduce costs, and we
established forward integration and co-location
partnerships with TPV, LG Display and Sharp.
However, due to high stock levels in retail and strong
price erosion, as well as a deterioration of results in
China as a consequence of a delay in closing the local
licensing agreement, TV was not profitable over the full
year. Year-on-year improvement in profitability
generated an EBITA loss of EUR 95 million, excluding
restructuring charges of EUR 30 million.
•Improve geographical coverage and strengthen position in
Brazil, Russia, India and China through managerial focus
and investment: We substantially increased our
advertising and promotion spend in emerging markets,
and continued to invest in local talent. We announced
our intention to move the global headquarters of our
Domestic Appliances business to Shanghai, as well as
investing in local business creation capabilities for
kitchen appliances across four local innovation centers.
Three of these centers are located in emerging markets.
•Accelerate excellence in key strategic capabilities:
leadership, professional endorsement, new channels, online,
category management and new business models: We
pioneered online and social media, including the Philips
AVENT support center for mothers, an impartial
resource supported by healthcare professionals. We
also implemented a major online and social media
campaign for our Wake-up Light, which featured the
residents of the most northerly town on Earth, where
almost four months of darkness makes waking in the
morning all that much tougher. We grew our online
sales by more than 20% year-on-year.
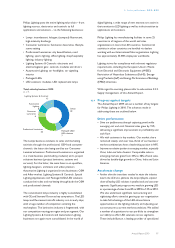
•Drive profitable growth through Green Products: We
introduced more than 150 new Green Products to our
portfolio in 2010, resulting in total Green Product sales
of 34% of sector sales. While the increase in Green
Product sales was achieved across all business areas, the
green focal area that saw the greatest improvement was
energy efficiency. We have also worked on the
voluntary phase-out of polyvinyl chloride (PVC) and
brominated flame retardants (BFR), enabling our
Lifestyle Entertainment and Personal Care businesses
to launch products which are completely free of these
substances. We launched the Econova LED TV,
Europe’s greenest LED TV, with a solar remote control.
Named “European Green TV 2010-2011” by the
European Imaging & Sound Association (EISA), the
Econova LED TV addresses people’s concerns about
the environment without compromising on
performance. It reduces energy consumption by up to
60% – the lowest in its category – and is made from 60%
recycled aluminum. Its packaging is 100% paper-based
cardboard, and it is completely PVC- and BFR-free.
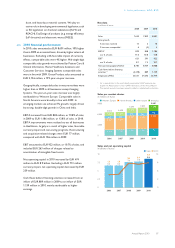
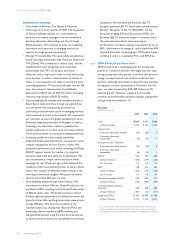
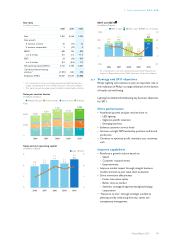
6.2.5 2010 financial performance
2010 proved to be a challenging year for driving sales
growth in Consumer Lifestyle. We began the year with
strong comparable sales growth in the first two quarters,
though we experienced sales declines in the last two
quarters, with high stock levels in retail and, consequently,
strong price erosion, particularly in Television. For the
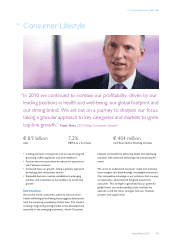
year, our sales increased by EUR 439 million, or 5%
nominal growth. However, adjusted for favorable
currency and unfavorable portfolio changes, comparable
sales growth was limited to 1%.
Key data
in millions of euros
2008 2009 2010
Sales 10,889 8,467 8,906
of which Television 4,724 3,122 3,155
Sales growth
% increase (decrease), nominal (17) (22) 5
% increase (decrease),
comparable1) (9) (17) 1
Sales growth excl. Television
% increase (decrease), nominal (13) (13) 8
% increase (decrease),
comparable1) (6) (12) 1
EBITA1) 126 339 639
of which Television (436) (179) (125)
as a % of sales 1.2 4.0 7.2
EBIT1) 110 321 595
of which Television (436) (179) (130)
as a % of sales 1.0 3.8 6.7
Net operating capital (NOC)1) 798 625 911
of which Television (238) (386) (299)
Cash flows before financing
activities1,2) 238 598 404
of which Television (487) (16) (117)
Employees (FTEs) 17,145 18,389 17,706
of which Television 4,742 4,766 3,613
1) For a reconciliation to the most directly comparable GAAP measures, see
chapter 16, Reconciliation of non-GAAP information, of this Annual Report
2) Prior period amounts have been revised to reflect an adjusted sector allocation