Philips 2010 Annual Report Download - page 209
Download and view the complete annual report
Please find page 209 of the 2010 Philips annual report below. You can navigate through the pages in the report by either clicking on the pages listed below, or by using the keyword search tool below to find specific information within the annual report.-
 1
1 -
2
-
3
-
4
-
5
-
6
-
7
-
8
-
9
-
10
-
11
-
12
-
13
-
14
-
15
-
16
-
17
-
18
-
19
-
20
-
21
-
22
-
23
-
24
-
25
-
26
-
27
-
28
-
29
-
30
-
31
-
32
-
33
-
34
-
35
-
36
-
37
-
38
-
39
-
40
-
41
-
42
-
43
-
44
-
45
-
46
-
47
-
48
-
49
-
50
-
51
-
52
-
53
-
54
-
55
-
56
-
57
-
58
-
59
-
60
-
61
-
62
-
63
-
64
-
65
-
66
-
67
-
68
-
69
-
70
-
71
-
72
-
73
-
74
-
75
-
76
-
77
-
78
-
79
-
80
-
81
-
82
-
83
-
84
-
85
-
86
-
87
-
88
-
89
-
90
-
91
-
92
-
93
-
94
-
95
-
96
-
97
-
98
-
99
-
100
-
101
-
102
-
103
-
104
-
105
-
106
-
107
-
108
-
109
-
110
-
111
-
112
-
113
-
114
-
115
-
116
-
117
-
118
-
119
-
120
-
121
-
122
-
123
-
124
-
125
-
126
-
127
-
128
-
129
-
130
-
131
-
132
-
133
-
134
-
135
-
136
-
137
-
138
-
139
-
140
-
141
-
142
-
143
-
144
-
145
-
146
-
147
-
148
-
149
-
150
-
151
-
152
-
153
-
154
-
155
-
156
-
157
-
158
-
159
-
160
-
161
-
162
-
163
-
164
-
165
-
166
-
167
-
168
-
169
-
170
-
171
-
172
-
173
-
174
-
175
-
176
-
177
-
178
-
179
-
180
-
181
-
182
-
183
-
184
-
185
-
186
-
187
-
188
-
189
-
190
-
191
-
192
-
193
-
194
-
195
-
196
-
197
-
198
-
 199
199 -
 200
200 -
 201
201 -
 202
202 -
 203
203 -
 204
204 -
 205
205 -
 206
206 -
 207
207 -
 208
208 -
 209
209 -
 210
210 -
 211
211 -
 212
212 -
 213
213 -
 214
214 -
 215
215 -
 216
216 -
 217
217 -
 218
218 -
 219
219 -
220
-
221
-
222
-
223
-
224
-
225
-
226
-
227
-
228
-
229
-
230
-
231
-
232
-
233
-
234
-
235
-
236
-
237
-
238
-
239
-
240
-
241
-
242
-
243
-
244
-
245
-
246
-
247
-
248
-
249
-
250
 |
 |

15 Sustainability statements 15 - 15
Annual Report 2010 209
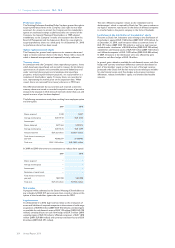
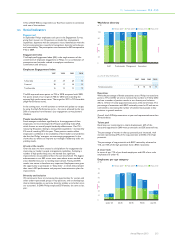
Sustainability programs and targets
All of our programs are guided by the Philips General Business
Principles, which provide the fundamental principles for all of our
business decisions and actions.
With our longstanding commitment to reducing the environmental
impact of our products and processes, we have been establishing action
programs with measurable targets since 1994. In 2010, we ran
EcoVision4 and EcoVision5 as well as our new Green Manufacturing
2015 program.
EcoVision4 which was launched in 2007 focuses on the environmental
performance of our products and reducing the energy consumption of
our operations. With EcoVision4 we have committed to realize the
following by 2012:
• generate 30% of total revenues from Green Products
• double investment in Green Innovations to a cumulative EUR 1
billion
• improve our operational energy efficiency by 25% and reduce CO2
emissions by 25%, all compared with the base year 2007.
In February 2010 we launched EcoVision5 comprising three
sustainability leadership key performance indicators on ‘care’, ‘energy
efficiency’ and ‘materials’ including targets for 2015 and a set of
complimentary performance indicators:
• bringing care to people (target: 500 million lives touched)
• improving energy efficiency of Philips products (target: 50%
improvement (for the average total product portfolio) compared to
2009
• closing the materials loop (target: double global collection and
recycling amounts and recycled materials in products compared to
2009).
In order to continue our efforts to improve our environmental
performance in manufacturing, we developed in 2010 our new Green
Manufacturing 2015 program, succeeding EcoVision III.
We report on the results of these programs versus targets.
In addition to our environmental initiatives we have been running
programs in other areas. Our employee programs include engagement,
diversity and inclusion, and health and safety. Through our Supplier
Sustainability Involvement Program we have been embedding
sustainability into our supply management processes since 2003.
Further, we have a targeted approach to our social investment program
that reflects our business. In keeping with this we rolled out our
SimplyHealthy@Schools program globally in 2010, educating children
on how to improve their health and well-being through exercise, food,
sleep and personal hygiene as well as installing energy-efficient lighting in
their schools. We also support healthcare projects that focus on
children.
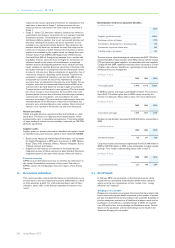
Scope of sustainability reporting
The scope of our sustainability performance reporting encompasses the
consolidated Philips Group activities, following the consolidation
criteria detailed in this section.
The consolidated selected financial information in this sustainability
statements section has been derived from the Group Financial
Statements, which are based on IFRS.
Comparability and completeness
For comparability reasons, all economic, environmental and social
performance data exclude the former activities of the Semiconductors
sector, which was divested in September 2006.
Environmental data are measured for those manufacturing sites with
more than 50 industrial employees. Integration of newly acquired
manufacturing sites is scheduled according to a defined integration
timetable (in principle, first full reporting year after the year of
acquisition) and subject to the integration agenda. Data for activities
that are divested during the reporting year are not included in full-year
reporting.
Social data cover all employees, including temporary employees, but
exclude contract workers. Due to the implementation of new HRM
systems, we are able to provide additional information on Philips
employees for 2009 and 2010. Historical comparisons, however, may
not be available.
Reporting of health and safety data is measured for units over 50 FTEs
and is voluntary for smaller units. New acquisitions must report, in
principle, the first year after acquisition and subject to the integration
agenda. Data for activities that are divested during the reporting year
are not included in full-year reporting.
Data definitions and scope
Green Products
Green Products offer a significant environmental improvement in one
or more Green Focal Areas: Energy efficiency, Packaging, Hazardous
substances, Weight, Recycling and disposal, and Lifetime reliability. The
life cycle approach is used to determine a product’s overall
environmental improvement. It calculates the environmental impact of
a product over its total life cycle (raw materials, manufacturing, product
use and disposal).
Green Products need to have a score in at least one Green Focal Area
that is significantly better (at least 10%), compared to the reference
product, which can be a competitor or predecessor product in the
particular product family. Because of different product portfolios,
sectors have specified additional criteria for Green Products.
Green Innovations
Green Innovations comprise all R&D activities directly contributing to
the development of Green Products or Green Technologies. A wide set
of additional criteria and boundaries have been defined as the basis for
internal and external validation.
Environmental data
All environmental data from manufacturing operations are reported on
a half-year basis in our intranet-based EcoVision reporting and
validation tool, according to defined company guidelines that include
definitions, procedures and calculation methods.
Internal validation processes are followed to ensure consistent data
quality. The sector validation officers provide support to the data
collectors at site level and regularly conduct audits to assess the
robustness of data reporting systems.
These EcoVision data from manufacturing are tracked and reported to
measure progress against our Green Manufacturing 2015 program
targets.
Reporting on ISO 14001 certification is based on manufacturing units
reporting in EcoVision.
Operational carbon footprint
The Philips operational carbon footprint is calculated on a half-year
basis and includes:
• Industrial sites – manufacturing and assembly sites
• Non-industrial sites – offices, warehouses, IT centers and R&D
facilities
• Business travel – lease and rental cars, and airplane travel
• Logistics – air, sea and road transport.
All emission factors used to transform input data (for example, amount
of ton-kilometers transported) into CO2 emissions are from the
Greenhouse Gas Protocol, except for business travel, where the
service providers supplied CO2 data based on their own verified
methodology. The Greenhouse Gas Protocol distinguishes three
scopes. It is mandatory to report on the first two.
• Scope 1 – direct CO2 emissions – is completely reported on with
direct emissions from our industrial and non-industrial sites.
Emissions from industrial sites, which consist of direct emissions
resulting from processes and fossil fuel combustion on site, are
reported in the EcoVision reporting system. Emissions from
industrial sites that are not yet reporting in EcoVision following
recent acquisitions are collected separately, or in case actual data is
not available, calculated based on average CO2 emissions per square
meter of comparable sites in the same sector. Energy use and CO2
emissions from non-industrial sites are based on actual data where
available. If this is not the case, they are estimated based on square
meters, taking the geographical location of the site into account.
• Scope 2 – CO2 emissions resulting from the generation of purchased
electricity for our premises – is completely reported on with
electricity use from industrial and non-industrial sites. Indirect CO2
emissions resulting from purchased electricity, steam and heat are
reported in the EcoVision reporting system. Those emissions of