Philips 2010 Annual Report Download - page 239
Download and view the complete annual report
Please find page 239 of the 2010 Philips annual report below. You can navigate through the pages in the report by either clicking on the pages listed below, or by using the keyword search tool below to find specific information within the annual report.-
 1
1 -
2
-
3
-
4
-
5
-
6
-
7
-
8
-
9
-
10
-
11
-
12
-
13
-
14
-
15
-
16
-
17
-
18
-
19
-
20
-
21
-
22
-
23
-
24
-
25
-
26
-
27
-
28
-
29
-
30
-
31
-
32
-
33
-
34
-
35
-
36
-
37
-
38
-
39
-
40
-
41
-
42
-
43
-
44
-
45
-
46
-
47
-
48
-
49
-
50
-
51
-
52
-
53
-
54
-
55
-
56
-
57
-
58
-
59
-
60
-
61
-
62
-
63
-
64
-
65
-
66
-
67
-
68
-
69
-
70
-
71
-
72
-
73
-
74
-
75
-
76
-
77
-
78
-
79
-
80
-
81
-
82
-
83
-
84
-
85
-
86
-
87
-
88
-
89
-
90
-
91
-
92
-
93
-
94
-
95
-
96
-
97
-
98
-
99
-
100
-
101
-
102
-
103
-
104
-
105
-
106
-
107
-
108
-
109
-
110
-
111
-
112
-
113
-
114
-
115
-
116
-
117
-
118
-
119
-
120
-
121
-
122
-
123
-
124
-
125
-
126
-
127
-
128
-
129
-
130
-
131
-
132
-
133
-
134
-
135
-
136
-
137
-
138
-
139
-
140
-
141
-
142
-
143
-
144
-
145
-
146
-
147
-
148
-
149
-
150
-
151
-
152
-
153
-
154
-
155
-
156
-
157
-
158
-
159
-
160
-
161
-
162
-
163
-
164
-
165
-
166
-
167
-
168
-
169
-
170
-
171
-
172
-
173
-
174
-
175
-
176
-
177
-
178
-
179
-
180
-
181
-
182
-
183
-
184
-
185
-
186
-
187
-
188
-
189
-
190
-
191
-
192
-
193
-
194
-
195
-
196
-
197
-
198
-
199
-
200
-
201
-
202
-
203
-
204
-
205
-
206
-
207
-
208
-
209
-
210
-
211
-
212
-
213
-
214
-
215
-
216
-
217
-
218
-
219
-
220
-
221
-
222
-
223
-
224
-
225
-
226
-
227
-
228
-
 229
229 -
 230
230 -
 231
231 -
 232
232 -
 233
233 -
 234
234 -
 235
235 -
 236
236 -
 237
237 -
 238
238 -
 239
239 -
 240
240 -
 241
241 -
 242
242 -
 243
243 -
 244
244 -
 245
245 -
 246
246 -
 247
247 -
 248
248 -
 249
249 -
250
 |
 |

18 Investor Relations 18.2.3 - 18.3
Annual Report 2010 239
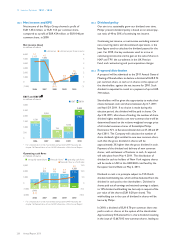
a 1.5% dilution. The remainder of the dividend was paid in
cash (EUR 296 million) against the retained earnings of the
Company.
ex-dividend
date record date payment date
Amsterdam
shares April 4, 2011 April 6, 2011 May 4, 2011
New York
shares April 4, 2011 April 6, 2011 May 4, 2011
Dividend and dividend yield per common share
■-dividend per share in euros----yield in %1)
1.00
0.80
0.60
0.40
0.20
0
0.9
0.36
2001
1.1
0.36
2002
2.2
0.36
2003
1.6
0.36
2004
2.1
0.40
2005
1.7
0.44
2006
2.1
0.60
2007
2.4
0.70
2008
5.1
0.70
2009
3.4
0.70
2010
3.3
0.75
20112)
1) Definition: Dividend yield % is as of December 31 of previous year
2) Subject to approval by the 2011 Annual General Meeting of Shareholders
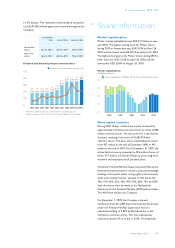
18.3 Share information
Market capitalization
Philips’ market capitalization was EUR 21.7 billion at year-
end 2010. The highest closing price for Philips’ shares
during 2010 in Amsterdam was EUR 26.94 on April 26,
2010 and the lowest was EUR 20.34 on January 22, 2010.
The highest closing price for Philips’ shares during 2010 in
New York was USD 35.90 on April 26, 2010 and the
lowest was USD 26.84 on August 24, 2010.
Market capitalization
in billions of euros
■
■-market capitalization of Philips--■-of which publicly quoted stakes
40
30
20
10
0
2006 2007 2008 2009 2010
Share capital structure
During 2010, Philips’ issued share capital increased by
approximately 14 million common shares to a level of 986
million common shares. The reason for this is the elective
dividend, resulting in the issue of 13,667,015 new
common shares. The basic shares outstanding increased
from 927 million at the end of December 2009 to 947
million at the end of 2010. As of December 31, 2010, the
shares held in treasury amounted to 39.6 million shares, of
which 37.7 million are held by Philips to cover long-term
incentive and employee stock purchase plans.
The Dutch Financial Markets Supervision Act (Wet op het
financieel toezicht) imposes a duty to disclose percentage
holdings in the capital and/or voting rights in the Company
when such holding reaches, exceeds or falls below 5%,
10%, 15%, 20%, 25%, 30%, 40%, 50%, 60%, 75% and 95%.
Such disclosure must be made to the Netherlands
Authority for the Financial Markets (AFM) without delay.
The AFM then notifies the Company.
On December 1, 2009, the Company received
notification from the AFM that it had received disclosures
under the Financial Markets Supervision Act of a
substantial holding of 5.03% by BlackRock Inc. in the
Company’s common shares. This was subsequently
reduced to below 5% as of July 2, 2010. The following