Philips 2010 Annual Report Download - page 165
Download and view the complete annual report
Please find page 165 of the 2010 Philips annual report below. You can navigate through the pages in the report by either clicking on the pages listed below, or by using the keyword search tool below to find specific information within the annual report.-
 1
1 -
2
-
3
-
4
-
5
-
6
-
7
-
8
-
9
-
10
-
11
-
12
-
13
-
14
-
15
-
16
-
17
-
18
-
19
-
20
-
21
-
22
-
23
-
24
-
25
-
26
-
27
-
28
-
29
-
30
-
31
-
32
-
33
-
34
-
35
-
36
-
37
-
38
-
39
-
40
-
41
-
42
-
43
-
44
-
45
-
46
-
47
-
48
-
49
-
50
-
51
-
52
-
53
-
54
-
55
-
56
-
57
-
58
-
59
-
60
-
61
-
62
-
63
-
64
-
65
-
66
-
67
-
68
-
69
-
70
-
71
-
72
-
73
-
74
-
75
-
76
-
77
-
78
-
79
-
80
-
81
-
82
-
83
-
84
-
85
-
86
-
87
-
88
-
89
-
90
-
91
-
92
-
93
-
94
-
95
-
96
-
97
-
98
-
99
-
100
-
101
-
102
-
103
-
104
-
105
-
106
-
107
-
108
-
109
-
110
-
111
-
112
-
113
-
114
-
115
-
116
-
117
-
118
-
119
-
120
-
121
-
122
-
123
-
124
-
125
-
126
-
127
-
128
-
129
-
130
-
131
-
132
-
133
-
134
-
135
-
136
-
137
-
138
-
139
-
140
-
141
-
142
-
143
-
144
-
145
-
146
-
147
-
148
-
149
-
150
-
151
-
152
-
153
-
154
-
 155
155 -
 156
156 -
 157
157 -
 158
158 -
 159
159 -
 160
160 -
 161
161 -
 162
162 -
 163
163 -
 164
164 -
 165
165 -
 166
166 -
 167
167 -
 168
168 -
 169
169 -
 170
170 -
 171
171 -
 172
172 -
 173
173 -
 174
174 -
 175
175 -
176
-
177
-
178
-
179
-
180
-
181
-
182
-
183
-
184
-
185
-
186
-
187
-
188
-
189
-
190
-
191
-
192
-
193
-
194
-
195
-
196
-
197
-
198
-
199
-
200
-
201
-
202
-
203
-
204
-
205
-
206
-
207
-
208
-
209
-
210
-
211
-
212
-
213
-
214
-
215
-
216
-
217
-
218
-
219
-
220
-
221
-
222
-
223
-
224
-
225
-
226
-
227
-
228
-
229
-
230
-
231
-
232
-
233
-
234
-
235
-
236
-
237
-
238
-
239
-
240
-
241
-
242
-
243
-
244
-
245
-
246
-
247
-
248
-
249
-
250
 |
 |

13 Group financial statements 13.11 - 13.11
Annual Report 2010 165
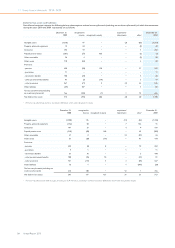
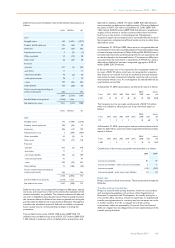
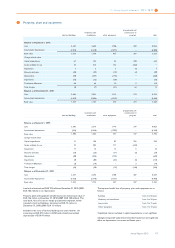
Deferred tax assets and liabilities relate to the balance sheet captions, as
follows:
assets liabilities net
2010
Intangible assets 104 (1,321) (1,217)
Property, plant & equipment 106 (66) 40
Inventories 267 (25) 242
Prepaid pension costs 2 (3) (1)
Other receivables 53 (15) 38
Other assets 50 (22) 28
Provisions:
- pensions 571 (2) 569
- guarantees 11 − 11
- termination benefits 70 (2) 68
- other postretirement 78 1 79
- other 579 (34) 545
Other liabilities 110 (28) 82
Tax loss carryforwards (including tax
credit carryforwards) 696 − 696
2,697 (1,517) 1,180
Set-off of deferred tax positions (1,346) 1,346 −
Net deferred tax assets 1,351 (171) 1,180
assets liabilities net
2009
Intangible assets 172 (1,390) (1,218)
Property, plant & equipment 109 (94) 15
Inventories 206 (13) 193
Prepaid pension costs 3 (390) (387)
Other receivables 45 (9) 36
Other assets 135 (17) 118
Provisions:
- pensions 452 (2) 450
- guarantees 11 − 11
- termination benefits 105 (5) 100
- other postretirement 91 − 91
- other 590 (23) 567
Other liabilities 73 (102) (29)
Tax loss carryforwards (including tax
credit carryforwards) 766 − 766
2,758 (2,045) 713
Set-off of deferred tax positions (1,515) 1,515 −
Net deferred tax assets 1,243 (530) 713
Deferred tax assets are recognized for temporary differences, unused
tax losses, and unused tax credits to the extent that realization of the
related tax benefits are probable. The ultimate realization of deferred
tax assets is dependent upon the generation of future taxable income in
the countries where the deferred tax assets originated and during the
periods when the deferred tax assets become deductible. Management
considers the scheduled reversal of deferred tax liabilities, projected
future taxable income, and tax planning strategies in making this
assessment.
The net deferred tax assets of EUR 1,180 million (2009: EUR 713
million) consist of deferred tax assets of EUR 1,351 million (2009: EUR
1,243 million) in countries with a net deferred tax asset position and
deferred tax liabilities of EUR 171 million (2009: EUR 530 million) in
countries with a net deferred tax liability position. Of the total deferred
tax assets of EUR 1,351 million at December 31, 2010, (2009: EUR
1,243 million), EUR 812 million (2009: EUR 616 million) is recognized in
respect of fiscal entities in various countries where there have been
fiscal losses in the current or preceding period. Management’s
projections support the assumption that it is probable that the results of
future operations will generate sufficient taxable income to utilize these
deferred tax assets.
At December 31, 2010 and 2009, there were no recognized deferred
tax liabilities for taxes that would be payable on the unremitted earnings
of certain foreign subsidiaries of Philips Holding USA (PHUSA) since it
has been determined that undistributed profits of such subsidiaries will
not be distributed in the foreseeable future. The temporary differences
associated with the investments in subsidiaries of PHUSA, for which a
deferred tax liability has not been recognized, aggregate to EUR 34
million (2009: EUR 29 million).
In the current year one of our acquisitions has recognized a deferred
tax asset of EUR 18 million, which was not recognized at acquisition
date. Based on an audit by the local tax authorities the intercompany
loan policy has been reviewed and adjusted, which has led to a lower
intercompany interest rate. As a consequence the related deferred tax
asset became recoverable.
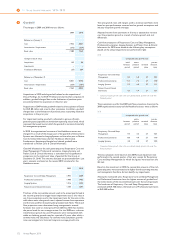
At December 31, 2010, operating loss carryforwards expire as follows:
Total 2011 2012 2013 2014 2015 2016/
2020 later unlimi-
ted
4,452 14 23 17 38 28 25 949 3,358
The Company also has tax credit carryforwards of EUR 112 million,
which are available to offset future tax, if any, and which expire as
follows:
Total 2011 2012 2013 2014 2015 2016/
2020 later unlimi-
ted
112 1 3 1 3 − 24 68 12
At December 31, 2010 , operating loss and tax credit carryforwards for
which no deferred tax assets have been recognized in the balance sheet,
expire as follows:
Total 2011 2012 2013 2014 2015 2016/
2020 later unlimi-
ted
1,689 − 2 − 6 5 28 16 1,632
Classification of the income tax payable and receivable is as follows:
2009 2010
Income tax receivable 81 79
Income tax receivable - under non-current receivables 2 2
Income tax payable (118) (291)
Income tax payable - under non-current liabilities (1) (1)
Fiscal risks
Philips is exposed to fiscal uncertainties. These uncertainties include the
following:
Transfer pricing uncertainties
Philips has issued transfer pricing directives, which are in accordance
with international guidelines such as those of the Organization of
Economic Co-operation and Development. As transfer pricing has a
cross-border effect, the focus of local tax authorities on implemented
transfer pricing procedures in a country may have an impact on results
in another country. In order to mitigate the transfer pricing
uncertainties, audits are executed by Corporate Fiscal and Internal
Audit on a regular basis to safeguard the correct implementation of the
transfer pricing directives.