Philips 2010 Annual Report Download - page 87
Download and view the complete annual report
Please find page 87 of the 2010 Philips annual report below. You can navigate through the pages in the report by either clicking on the pages listed below, or by using the keyword search tool below to find specific information within the annual report.-
 1
1 -
2
-
3
-
4
-
5
-
6
-
7
-
8
-
9
-
10
-
11
-
12
-
13
-
14
-
15
-
16
-
17
-
18
-
19
-
20
-
21
-
22
-
23
-
24
-
25
-
26
-
27
-
28
-
29
-
30
-
31
-
32
-
33
-
34
-
35
-
36
-
37
-
38
-
39
-
40
-
41
-
42
-
43
-
44
-
45
-
46
-
47
-
48
-
49
-
50
-
51
-
52
-
53
-
54
-
55
-
56
-
57
-
58
-
59
-
60
-
61
-
62
-
63
-
64
-
65
-
66
-
67
-
68
-
69
-
70
-
71
-
72
-
73
-
74
-
75
-
76
-
 77
77 -
 78
78 -
 79
79 -
 80
80 -
 81
81 -
 82
82 -
 83
83 -
 84
84 -
 85
85 -
 86
86 -
 87
87 -
 88
88 -
 89
89 -
 90
90 -
 91
91 -
 92
92 -
 93
93 -
 94
94 -
 95
95 -
 96
96 -
 97
97 -
98
-
99
-
100
-
101
-
102
-
103
-
104
-
105
-
106
-
107
-
108
-
109
-
110
-
111
-
112
-
113
-
114
-
115
-
116
-
117
-
118
-
119
-
120
-
121
-
122
-
123
-
124
-
125
-
126
-
127
-
128
-
129
-
130
-
131
-
132
-
133
-
134
-
135
-
136
-
137
-
138
-
139
-
140
-
141
-
142
-
143
-
144
-
145
-
146
-
147
-
148
-
149
-
150
-
151
-
152
-
153
-
154
-
155
-
156
-
157
-
158
-
159
-
160
-
161
-
162
-
163
-
164
-
165
-
166
-
167
-
168
-
169
-
170
-
171
-
172
-
173
-
174
-
175
-
176
-
177
-
178
-
179
-
180
-
181
-
182
-
183
-
184
-
185
-
186
-
187
-
188
-
189
-
190
-
191
-
192
-
193
-
194
-
195
-
196
-
197
-
198
-
199
-
200
-
201
-
202
-
203
-
204
-
205
-
206
-
207
-
208
-
209
-
210
-
211
-
212
-
213
-
214
-
215
-
216
-
217
-
218
-
219
-
220
-
221
-
222
-
223
-
224
-
225
-
226
-
227
-
228
-
229
-
230
-
231
-
232
-
233
-
234
-
235
-
236
-
237
-
238
-
239
-
240
-
241
-
242
-
243
-
244
-
245
-
246
-
247
-
248
-
249
-
250
 |
 |
6 Sector performance 6.1.4 - 6.1.5
Annual Report 2010 87
dose, and hazardous material content. We play an
active role in developing environmental legislation, such
as EU legislation on chemical substances (RoHS and
REACH), EcoDesign of products (e.g. energy efficiency;
EuP directive) and electronic waste (WEEE).
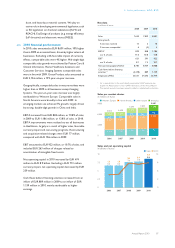
6.1.5 2010 financial performance
In 2010, sales amounted to EUR 8,601 million, 10% higher
than in 2009 on a nominal basis, driven by higher sales in all
businesses. Excluding a 6% favorable impact of currency
effects, comparable sales were 4% higher. Mid-single-digit
comparable sales growth was achieved by Patient Care &
Clinical Informatics, Home Healthcare Solutions and
Customer Services. Imaging Systems comparable sales
were in line with 2009. Green Product sales amounted to
EUR 2,136 million, a 19% year-on-year increase.
Geographically, comparable sales in mature markets were
higher than in 2009 in all businesses except Imaging
Systems. The year-on-year sales increase was largely
attributable to Western Europe. Comparable sales in
North America were broadly in line with 2009. In
emerging markets we achieved 7% growth, largely driven
by strong, double-digit growth in China and India.
EBITA increased from EUR 848 million, or 10.8% of sales,
in 2009 to EUR 1,186 million, or 13.8% of sales, in 2010.
EBITA improvements were realized across all businesses
in Healthcare, largely as a result of higher sales, favorable
currency impact and cost-saving programs. Restructuring
and acquisition-related charges were EUR 77 million,
compared with EUR 106 million in 2009.
EBIT amounted to EUR 922 million, or 10.7% of sales, and
included EUR 263 million of charges related to
amortization of intangible fixed assets.
Net operating capital in 2010 increased by EUR 474
million to EUR 8.9 billion. Excluding a EUR 713 million
currency impact, net operating capital decreased by EUR
239 million.
Cash flows before financing activities increased from an
inflow of EUR 889 million in 2009 to an inflow of EUR
1,139 million in 2010, mainly attributable to higher
earnings.
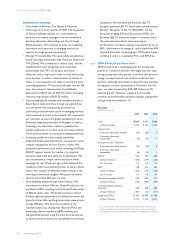
Key data
in millions of euros
2008 2009 2010
Sales 7,649 7,839 8,601
Sales growth
% increase, nominal 15 2 10
% increase, comparable1) 6 (3) 4
EBITA1) 839 848 1,186
as a % of sales 11.0 10.8 13.8
EBIT1) 621 591 922
as a % of sales 8.1 7.5 10.7
Net operating capital (NOC)1) 8,785 8,434 8,908
Cash flows before financing
activities1,2) (2,478) 889 1,139
Employees (FTEs) 35,551 34,296 35,479
1) For a reconciliation to the most directly comparable GAAP measures, see
chapter 16, Reconciliation of non-GAAP information, of this Annual Report
2) Prior period amounts have been revised to reflect an adjusted sector allocation
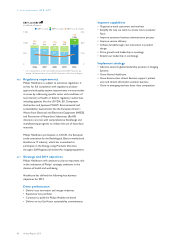
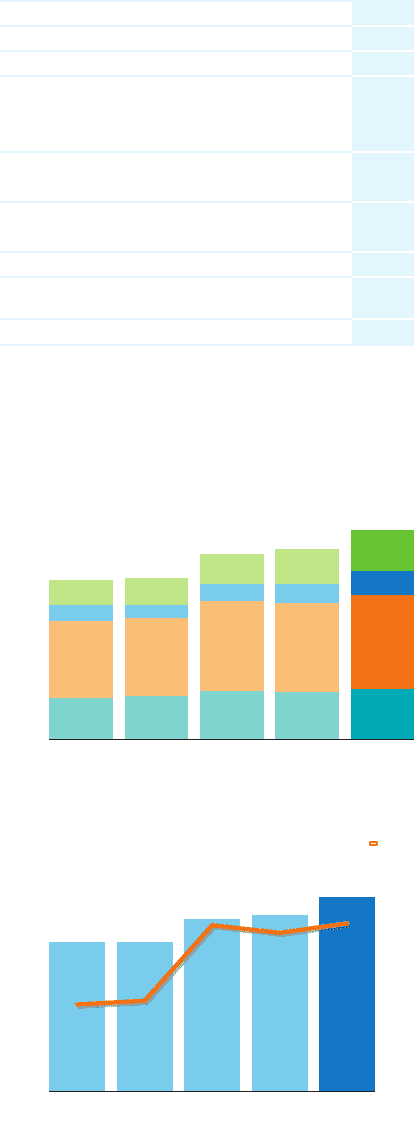
Sales per market cluster
in millions of euros
■-Western Europe--■-North America--■-other mature--■-emerging
9,000
6,000
3,000
0
2006
1,704
3,167
642
1,049
6,562
2007
1,767
3,215
559
1,097
6,638
2008
1,961
3,747
670
1,271
7,649
2009
1,941
3,685
763
1,450
7,839
2010
2,042
3,901
968
1,690
8,601
Sales and net operating capital
in billions of euros ■-Sales----NOC
10
7.5
5
2.5
0
12
9
6
3
0
4.6
6.6
2006
4.8
6.6
2007
8.8
7.6
2008
8.4
7.8
2009
8.9
8.6
2010