Philips 2010 Annual Report Download - page 65
Download and view the complete annual report
Please find page 65 of the 2010 Philips annual report below. You can navigate through the pages in the report by either clicking on the pages listed below, or by using the keyword search tool below to find specific information within the annual report.-
 1
1 -
2
-
3
-
4
-
5
-
6
-
7
-
8
-
9
-
10
-
11
-
12
-
13
-
14
-
15
-
16
-
17
-
18
-
19
-
20
-
21
-
22
-
23
-
24
-
25
-
26
-
27
-
28
-
29
-
30
-
31
-
32
-
33
-
34
-
35
-
36
-
37
-
38
-
39
-
40
-
41
-
42
-
43
-
44
-
45
-
46
-
47
-
48
-
49
-
50
-
51
-
52
-
53
-
54
-
 55
55 -
 56
56 -
 57
57 -
 58
58 -
 59
59 -
 60
60 -
 61
61 -
 62
62 -
 63
63 -
 64
64 -
 65
65 -
 66
66 -
 67
67 -
 68
68 -
 69
69 -
 70
70 -
 71
71 -
 72
72 -
 73
73 -
 74
74 -
 75
75 -
76
-
77
-
78
-
79
-
80
-
81
-
82
-
83
-
84
-
85
-
86
-
87
-
88
-
89
-
90
-
91
-
92
-
93
-
94
-
95
-
96
-
97
-
98
-
99
-
100
-
101
-
102
-
103
-
104
-
105
-
106
-
107
-
108
-
109
-
110
-
111
-
112
-
113
-
114
-
115
-
116
-
117
-
118
-
119
-
120
-
121
-
122
-
123
-
124
-
125
-
126
-
127
-
128
-
129
-
130
-
131
-
132
-
133
-
134
-
135
-
136
-
137
-
138
-
139
-
140
-
141
-
142
-
143
-
144
-
145
-
146
-
147
-
148
-
149
-
150
-
151
-
152
-
153
-
154
-
155
-
156
-
157
-
158
-
159
-
160
-
161
-
162
-
163
-
164
-
165
-
166
-
167
-
168
-
169
-
170
-
171
-
172
-
173
-
174
-
175
-
176
-
177
-
178
-
179
-
180
-
181
-
182
-
183
-
184
-
185
-
186
-
187
-
188
-
189
-
190
-
191
-
192
-
193
-
194
-
195
-
196
-
197
-
198
-
199
-
200
-
201
-
202
-
203
-
204
-
205
-
206
-
207
-
208
-
209
-
210
-
211
-
212
-
213
-
214
-
215
-
216
-
217
-
218
-
219
-
220
-
221
-
222
-
223
-
224
-
225
-
226
-
227
-
228
-
229
-
230
-
231
-
232
-
233
-
234
-
235
-
236
-
237
-
238
-
239
-
240
-
241
-
242
-
243
-
244
-
245
-
246
-
247
-
248
-
249
-
250
 |
 |

5 Group performance 5.1.11 - 5.1.12
Annual Report 2010 65
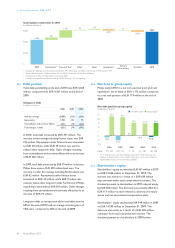
sales in North America were on par with 2009 on a
comparable basis. Sales in other mature markets,
however, grew by double-digits in all sectors.
In emerging markets, sales grew by 12%, driven by growth
in all sectors, notably Lighting (more than 20%). Solid
double-digit growth was visible in China, driven by
Healthcare and Lighting. Sales in Russia also showed
double-digit growth, attributable to strong sales
performance at Consumer Lifestyle and Lighting.
Sales per market cluster
in millions of euros
■-Western Europe--■-North America--■-other mature--■-emerging
30,000
20,000
10,000
0
2008
9,518
7,577 1,269
8,021
26,385
20091)
8,389
6,609 1,260
6,931
23,189
2010
8,363
7,086 1,633
8,337
25,419
1) Revised to reflect an adjusted market cluster allocation
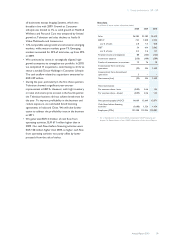
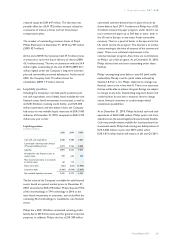
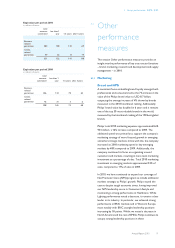
5.1.12 Employment
The total number of employees of the Philips Group was
119,001 at the end of 2010, compared to 115,924 at the
end of 2009. Approximately 45% were employed in the
Lighting sector, due to the continued relatively strong
vertical integration in this business. Some 30% were
employed in the Healthcare sector and approximately
15% of the workforce was employed in the Consumer
Lifestyle sector.
Employees per sector 2010
in FTEs at year-end
Healthcare
35,479
Consumer Lifestyle
17,706
Lighting
53,888
Group Management & Services
11,928
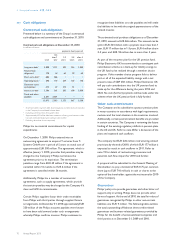
The increase in headcount in 2010 was mainly attributable
to acquisitions and an increase in temporary employees in
Lighting to support higher levels of activity. The number of
employees increased in all sectors except Consumer
Lifestyle, which was lower, mainly due to a reduction of
temporary employees in Television.
Approximately 55% of the Philips workforce is located in
mature markets, and about 45% in emerging markets. In
2010, the number of employees in mature markets slightly
declined as additional headcount from acquisitions was
more than offset by headcount reduction from
organizational right-sizing projects. Emerging market
headcount increased by 3,195, mainly from increases at
Lighting to support higher factory production.
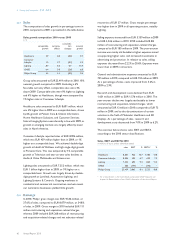
Employees per sector
in FTEs at year-end
2008 2009 2010
Healthcare 35,551 34,296 35,479
Consumer Lifestyle 17,145 18,389 17,706
Lighting 57,367 51,653 53,888
GM&S 11,335 11,586 11,928
121,398 115,924 119,001
Employees per market cluster
in FTEs at year-end
2008 2009 2010
Western Europe 36,966 35,496 34,613
North America 31,336 27,069 27,883
Other mature markets 2,119 3,095 3,046
Total mature markets 70,421 65,660 65,542
Emerging markets 50,977 50,264 53,459
121,398 115,924 119,001
Employment
in FTEs
2008 2009 2010
Position at beginning of year 123,801 121,398 115,924
Consolidation changes:
- new consolidations 12,673 2,432 1,457
- deconsolidations (1,571) (276) (307)
Comparable change (13,505) (7,630) 1,927
Position at year-end 121,398 115,924 119,001