Philips 2010 Annual Report Download - page 238
Download and view the complete annual report
Please find page 238 of the 2010 Philips annual report below. You can navigate through the pages in the report by either clicking on the pages listed below, or by using the keyword search tool below to find specific information within the annual report.-
 1
1 -
2
-
3
-
4
-
5
-
6
-
7
-
8
-
9
-
10
-
11
-
12
-
13
-
14
-
15
-
16
-
17
-
18
-
19
-
20
-
21
-
22
-
23
-
24
-
25
-
26
-
27
-
28
-
29
-
30
-
31
-
32
-
33
-
34
-
35
-
36
-
37
-
38
-
39
-
40
-
41
-
42
-
43
-
44
-
45
-
46
-
47
-
48
-
49
-
50
-
51
-
52
-
53
-
54
-
55
-
56
-
57
-
58
-
59
-
60
-
61
-
62
-
63
-
64
-
65
-
66
-
67
-
68
-
69
-
70
-
71
-
72
-
73
-
74
-
75
-
76
-
77
-
78
-
79
-
80
-
81
-
82
-
83
-
84
-
85
-
86
-
87
-
88
-
89
-
90
-
91
-
92
-
93
-
94
-
95
-
96
-
97
-
98
-
99
-
100
-
101
-
102
-
103
-
104
-
105
-
106
-
107
-
108
-
109
-
110
-
111
-
112
-
113
-
114
-
115
-
116
-
117
-
118
-
119
-
120
-
121
-
122
-
123
-
124
-
125
-
126
-
127
-
128
-
129
-
130
-
131
-
132
-
133
-
134
-
135
-
136
-
137
-
138
-
139
-
140
-
141
-
142
-
143
-
144
-
145
-
146
-
147
-
148
-
149
-
150
-
151
-
152
-
153
-
154
-
155
-
156
-
157
-
158
-
159
-
160
-
161
-
162
-
163
-
164
-
165
-
166
-
167
-
168
-
169
-
170
-
171
-
172
-
173
-
174
-
175
-
176
-
177
-
178
-
179
-
180
-
181
-
182
-
183
-
184
-
185
-
186
-
187
-
188
-
189
-
190
-
191
-
192
-
193
-
194
-
195
-
196
-
197
-
198
-
199
-
200
-
201
-
202
-
203
-
204
-
205
-
206
-
207
-
208
-
209
-
210
-
211
-
212
-
213
-
214
-
215
-
216
-
217
-
218
-
219
-
220
-
221
-
222
-
223
-
224
-
225
-
226
-
227
-
 228
228 -
 229
229 -
 230
230 -
 231
231 -
 232
232 -
 233
233 -
 234
234 -
 235
235 -
 236
236 -
 237
237 -
 238
238 -
 239
239 -
 240
240 -
 241
241 -
 242
242 -
 243
243 -
 244
244 -
 245
245 -
 246
246 -
 247
247 -
 248
248 -
249
-
250
 |
 |

18 Investor Relations 18.2.1 - 18.2.3
238 Annual Report 2010
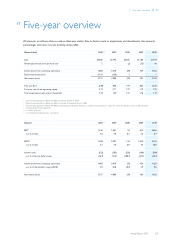
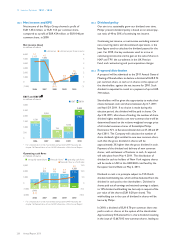
18.2.1 Net income and EPS
Net income of the Philips Group showed a profit of
EUR 1,452 million, or EUR 1.53 per common share,
compared to a profit of EUR 424 million, or EUR 0.46 per
common share, in 2009.
Net income (loss)
in millions of euros
■-net income ----net income per share in euros
6,000
5,000
4,000
3,000
2,000
1,000
0
(1,000)
6
5
4
3
2
1
0
(1)
4.4
5,157
2006
4.5
4,880
2007
(0.1)
(92)
2008
0.5
424
2009
1.5
1,452
2010
424
EBIT and EBITA1)
in millions of euros ■-EBIT--■
■-EBITA
3,000
2,500
2,000
1,500
1,000
500
0
1,336
192
1,528
2006
1,867
227
2,094
2007
54
690
744
2008
614
436
1,050
2009
2,065
487
2,552
2010
1) For a reconciliation to the most directly comparable GAAP measures, see
chapter 16, Reconciliation of non-GAAP information, of this Annual Report
Operating cash flows
in millions of euros
■-net capital expenditure--■
■-free cash flows1)--■-operating cash flows
--free cash flow as a % of sales
3,000
2,000
1,000
0
(1,000)
(2,000)
15.0
10.0
5.0
0
(5.0)
(10.0)
639
(987)
(348)
(1.3)
2006
1,752
(928)
824
3.1
2007
1,648
(875)
773
2.9
2008
1,545
(682)
863
3.7
2009
2,156
(823)
1,333
5.2
2010
1) For a reconciliation to the most directly comparable GAAP measures, see
chapter 16, Reconciliation of non-GAAP information, of this Annual Report
18.2.2 Dividend policy
Our aim is to sustainably grow our dividend over time.
Philips’ present dividend policy is based on an annual pay-
out ratio of 40 to 50% of continuing net income.
Continuing net income, or net income excluding material
non-recurring items and discontinued operations, is the
base figure used to calculate the dividend payout for the
year. For 2010, the key exclusions used to arrive at
continuing net income are the gain on the sale of shares in
NXP and TPV, the curtailment in the UK Pension
Fund, and restructuring and post-acquisition charges.
18.2.3 Proposed distribution
A proposal will be submitted to the 2011 Annual General
Meeting of Shareholders to declare a dividend of EUR 0.75
per common share, in cash or in shares at the option of
the shareholder, against the net income for 2010. Such
dividend is expected to result in a payment of up to EUR
710 million.
Shareholders will be given the opportunity to make their
choice between cash and shares between April 7, 2011
and April 29, 2011. If no choice is made during this
election period, the dividend will be paid in shares. On
April 29, 2011, after close of trading, the number of share
dividend rights entitled to one new common share will be
determined based on the volume-weighted average price
of all traded common shares of Koninklijke Philips
Electronics N.V. at Euronext Amsterdam on 27, 28 and 29
April 2011. The Company will calculate the number of
share dividend rights entitled to one new common share,
such that the gross dividend in shares will be
approximately 3% higher than the gross dividend in cash.
Payment of the dividend and delivery of new common
shares, with settlement of fractions in cash, if required,
will take place from May 4, 2011. The distribution of
dividend in cash to holders of New York registry shares
will be made in USD at the USD/EUR rate fixed by the
European Central Bank on May 2, 2011.
Dividend in cash is in principle subject to 15% Dutch
dividend withholding tax, which will be deducted from the
dividend in cash paid to the shareholders. Dividend in
shares paid out of earnings and retained earnings is subject
to 15% dividend withholding tax, but only in respect of the
par value of the shares (EUR 0.20 per share). This
withholding tax in the case of dividend in shares will be
borne by Philips.
In 2010, a dividend of EUR 0.70 per common share was
paid in cash or shares, at the option of the shareholder.
Approximately 53% elected for a share dividend resulting
in the issue of 13,667,015 new common shares, leading to