Philips 2010 Annual Report Download - page 98
Download and view the complete annual report
Please find page 98 of the 2010 Philips annual report below. You can navigate through the pages in the report by either clicking on the pages listed below, or by using the keyword search tool below to find specific information within the annual report.-
 1
1 -
2
-
3
-
4
-
5
-
6
-
7
-
8
-
9
-
10
-
11
-
12
-
13
-
14
-
15
-
16
-
17
-
18
-
19
-
20
-
21
-
22
-
23
-
24
-
25
-
26
-
27
-
28
-
29
-
30
-
31
-
32
-
33
-
34
-
35
-
36
-
37
-
38
-
39
-
40
-
41
-
42
-
43
-
44
-
45
-
46
-
47
-
48
-
49
-
50
-
51
-
52
-
53
-
54
-
55
-
56
-
57
-
58
-
59
-
60
-
61
-
62
-
63
-
64
-
65
-
66
-
67
-
68
-
69
-
70
-
71
-
72
-
73
-
74
-
75
-
76
-
77
-
78
-
79
-
80
-
81
-
82
-
83
-
84
-
85
-
86
-
87
-
 88
88 -
 89
89 -
 90
90 -
 91
91 -
 92
92 -
 93
93 -
 94
94 -
 95
95 -
 96
96 -
 97
97 -
 98
98 -
 99
99 -
 100
100 -
 101
101 -
 102
102 -
 103
103 -
 104
104 -
 105
105 -
 106
106 -
 107
107 -
 108
108 -
109
-
110
-
111
-
112
-
113
-
114
-
115
-
116
-
117
-
118
-
119
-
120
-
121
-
122
-
123
-
124
-
125
-
126
-
127
-
128
-
129
-
130
-
131
-
132
-
133
-
134
-
135
-
136
-
137
-
138
-
139
-
140
-
141
-
142
-
143
-
144
-
145
-
146
-
147
-
148
-
149
-
150
-
151
-
152
-
153
-
154
-
155
-
156
-
157
-
158
-
159
-
160
-
161
-
162
-
163
-
164
-
165
-
166
-
167
-
168
-
169
-
170
-
171
-
172
-
173
-
174
-
175
-
176
-
177
-
178
-
179
-
180
-
181
-
182
-
183
-
184
-
185
-
186
-
187
-
188
-
189
-
190
-
191
-
192
-
193
-
194
-
195
-
196
-
197
-
198
-
199
-
200
-
201
-
202
-
203
-
204
-
205
-
206
-
207
-
208
-
209
-
210
-
211
-
212
-
213
-
214
-
215
-
216
-
217
-
218
-
219
-
220
-
221
-
222
-
223
-
224
-
225
-
226
-
227
-
228
-
229
-
230
-
231
-
232
-
233
-
234
-
235
-
236
-
237
-
238
-
239
-
240
-
241
-
242
-
243
-
244
-
245
-
246
-
247
-
248
-
249
-
250
 |
 |
6 Sector performance 6.3.4 - 6.3.5
98 Annual Report 2010
lighting solutions for healthcare facilities, and NCW
Holdings, a leading Chinese provider of entertainment
lighting and lighting control solutions.
•Continue to invest in extending technological leadership in
LED: We made significant R&D and capital investments
in LED, including Lumileds, and made considerable
progress in creating an integrated LED value chain
across Lighting.
Implement strategy
•Become the lighting solutions leader in the Outdoor segment:
We significantly expanded our LED road lighting
portfolio in all regions. We have a healthy project
pipeline for LED road lighting in China and continue to
invest in R&D and our sales force to enhance our
offering into turnkey projects. In 2010 we also acquired
Amplex’s street lighting controls business to further
expand our street lighting offering.
•Grow our Consumer Luminaires business: We made
considerable progress in expanding the business
outside Europe. Overall, sales remained broadly in line
with 2009 due to ongoing weakness in the residential
market in Europe, the business’s core market. The
acquisition of Luceplan, a leading high-end design brand
in consumer lighting has further strengthened our
portfolio.
•Implement our new Lighting mission, identity and
sustainability story – “Simply enhancing life with light”: We
have trained more than 85% of all our employees on our
new Lighting mission and have seen the uptake reflected
in our Employee Engagement Survey and in the positive
reactions of external stakeholders, e.g. at Light +
Building 2010 and our Capital Markets Day.
In 2010 we invested EUR 230 million in Green
Innovation, compared to EUR 185 million in 2009. The
energy efficiency of our total product portfolio
improved by 9%.
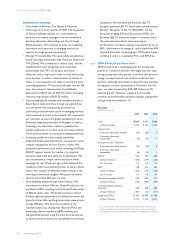
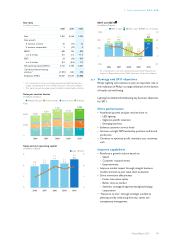
6.3.5 2010 financial performance
Sales amounted to EUR 7,552 million, a nominal increase
of 15% compared to 2009, driven by a rebound in sales of
general and automotive lamps as well as ongoing growth
of our Lumileds LED business. Excluding a 6% favorable
currency impact and a 1% contribution from acquisitions,
comparable sales increased by 9%.
The year-on-year sales increase was substantially driven
by growth in emerging markets, which grew over 20% on a
comparable basis. Emerging market sales grew to over
38% of total Lighting sales, driven by China, India and
Brazil, compared to 34% in 2009. In mature markets, sales
growth was limited to low single-digits due to lower
demand in North America and Western Europe,
particularly for Professional and Consumer Luminaires.
A rebound in the global automotive market supported
solid, double-digit sales growth in this business. Our
general Lamps business also grew strongly compared to
2009, buoyed by demand for high-end lamps in retail and
emerging geographies. Ongoing softness in both the
residential and commercial construction markets –
particularly in mature geographies – meant that sales in
our Luminaires businesses remained broadly in line with
2009. Sales of LED-based products grew to over 13% of
total sales, up from 8% in 2009, driven by Lumileds, Lamps
and Professional Luminaires. Sales of energy-efficient
Green Products exceeded EUR 4 billion, or 58% of sector
sales.
EBITA amounted to EUR 869 million, or 11.5% of sales,
which included EUR 96 million of restructuring and
acquisition-related charges. This compared to EUR 247
million of restructuring and acquisition-related charges in
2009. The EBITA improvement was driven by higher sales,
improved gross margin and fixed cost savings from
restructuring programs.
EBIT amounted to EUR 695 million, or 9.2% of sales,
which included EUR 174 million of amortization of
intangible fixed assets, mainly from Lumileds and Genlyte.
Net operating capital increased by EUR 457 million to
EUR 5.6 billion, due to unfavorable currency translation,
higher activity levels and additional LED-related capital
expenditures.
Cash flows before financing activities declined from EUR
624 million in 2009 to EUR 590 million, reflecting higher
cash earnings which were more than offset by higher
working capital requirements and additional growth-
focused investments in capital expenditures.