Philips 2010 Annual Report Download - page 175
Download and view the complete annual report
Please find page 175 of the 2010 Philips annual report below. You can navigate through the pages in the report by either clicking on the pages listed below, or by using the keyword search tool below to find specific information within the annual report.-
 1
1 -
2
-
3
-
4
-
5
-
6
-
7
-
8
-
9
-
10
-
11
-
12
-
13
-
14
-
15
-
16
-
17
-
18
-
19
-
20
-
21
-
22
-
23
-
24
-
25
-
26
-
27
-
28
-
29
-
30
-
31
-
32
-
33
-
34
-
35
-
36
-
37
-
38
-
39
-
40
-
41
-
42
-
43
-
44
-
45
-
46
-
47
-
48
-
49
-
50
-
51
-
52
-
53
-
54
-
55
-
56
-
57
-
58
-
59
-
60
-
61
-
62
-
63
-
64
-
65
-
66
-
67
-
68
-
69
-
70
-
71
-
72
-
73
-
74
-
75
-
76
-
77
-
78
-
79
-
80
-
81
-
82
-
83
-
84
-
85
-
86
-
87
-
88
-
89
-
90
-
91
-
92
-
93
-
94
-
95
-
96
-
97
-
98
-
99
-
100
-
101
-
102
-
103
-
104
-
105
-
106
-
107
-
108
-
109
-
110
-
111
-
112
-
113
-
114
-
115
-
116
-
117
-
118
-
119
-
120
-
121
-
122
-
123
-
124
-
125
-
126
-
127
-
128
-
129
-
130
-
131
-
132
-
133
-
134
-
135
-
136
-
137
-
138
-
139
-
140
-
141
-
142
-
143
-
144
-
145
-
146
-
147
-
148
-
149
-
150
-
151
-
152
-
153
-
154
-
155
-
156
-
157
-
158
-
159
-
160
-
161
-
162
-
163
-
164
-
 165
165 -
 166
166 -
 167
167 -
 168
168 -
 169
169 -
 170
170 -
 171
171 -
 172
172 -
 173
173 -
 174
174 -
 175
175 -
 176
176 -
 177
177 -
 178
178 -
 179
179 -
 180
180 -
 181
181 -
 182
182 -
 183
183 -
 184
184 -
 185
185 -
186
-
187
-
188
-
189
-
190
-
191
-
192
-
193
-
194
-
195
-
196
-
197
-
198
-
199
-
200
-
201
-
202
-
203
-
204
-
205
-
206
-
207
-
208
-
209
-
210
-
211
-
212
-
213
-
214
-
215
-
216
-
217
-
218
-
219
-
220
-
221
-
222
-
223
-
224
-
225
-
226
-
227
-
228
-
229
-
230
-
231
-
232
-
233
-
234
-
235
-
236
-
237
-
238
-
239
-
240
-
241
-
242
-
243
-
244
-
245
-
246
-
247
-
248
-
249
-
250
 |
 |
13 Group financial statements 13.11 - 13.11 12 13 14 15 16
Annual Report 2010 175
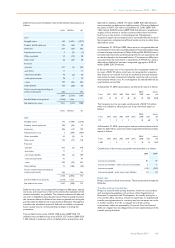
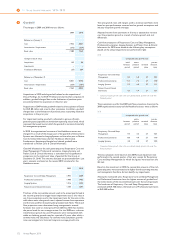
Until August 5, 2010 NXP was a privately-held company that was not
quoted in any active market and consequently carried at impaired cost
because the fair value could not be reliably determined. Until that date
Philips performed impairment reviews on the carrying value of the
investment in NXP.
According to IAS 39, if there is objective evidence that an impairment
loss has been incurred for an unquoted equity investment carried at
cost, the amount of the impairment loss is measured as the difference
between the carrying amount of the investment and the present value of
the estimated discounted future cash flows. The discounted future cash
flows for NXP were estimated using various valuation techniques
including multiplier calculations (‘EBITDA multiples’), calculations based
on the share price performance of a peer group of listed
(semiconductor) companies and discounted cash-flow models based on
unobservable inputs. The latter methodology involved estimates of
revenues, expenses, capital spending and other costs, as well as a
discount rate calculated from the risk profile of the semiconductor
industry. At the end of the first quarter of 2009, impairment charges
were recognized in the amount of EUR 48 million, which resulted in a
carrying amount of EUR 207 million, being management’s best estimate
of future cash flows for the NXP investment at that time. Based on the
impairment reviews performed between the end of the first quarter
2009 and August 5, 2010 it was concluded that no further impairments
were necessary.
On August 6, 2010 NXP completed an initial public offering (IPO) of
newly issued common shares at the NASDAQ. The consequence of this
IPO was firstly that the interest held by Philips was diluted to 17% and
secondly that a reliable measure became available in order to fair value
the NXP shares held by Philips. The difference between the fair value
determined on the basis of the initial offering price (EUR 455 million)
and the impaired cost (EUR 207 million) was recorded in equity (Other
comprehensive income) in August 2010. Subsequent changes in the fair
value until September 7, 2010 were also recognized in equity.
On September 7, 2010 Philips sold its entire holding of common shares
in NXP to Philips Pension Trustees Limited (herein after referred to as
“UK Pension Fund”) for a consideration of EUR 361 million which was
8% below the fair value determined on the stock price as of the close of
the previous business day. The transaction resulted in a gain of EUR 154
million, reported under Financial income.
The purchase agreement with the UK Pension Fund includes an
arrangement that may entitle Philips to a cash payment from the UK
Pension Fund on or after September 7, 2014 if the value of the NXP
shares has increased by this date to a level in excess of a predetermined
threshold, which at the time of the transaction was substantially above
the transaction price, and the UK Pension Fund is in a surplus (on the
regulatory funding basis) on September 7, 2014.
The arrangement qualifies as a financial instrument, which must be
accounted for at fair value, with fair value changes to be reported in
financial income and expenses. The fair value of the arrangement was
estimated to be zero at the transaction date. As of December 31, 2010,
the share price of NXP exceeded the threshold in the arrangement,
however, the UK Pension Fund was still in a regulatory deficit position
on this date. Management estimates, based on the risks, the current
progress and the long term nature of the recovery plan, that it is still
highly uncertain that the UK Pension Fund will achieve a regulatory
surplus by September 7, 2014. Therefore, the fair value of the
arrangement on December 31, 2010 is estimated to be zero.
On March 18, 2010 TPO Displays Corp. (TPO Displays) merged with
Innolux Display Corp. and Chi Mei Optoelectronics into a new
company named Chimei Innolux Corporation (Chimei Innolux). The
shares held by Philips in TPO Displays were exchanged into shares of
Chimei Innolux. Valuation differences between the shares were
recognized in Other comprehensive income.
Loans and receivables
Loans and receivables mainly relate to restricted liquid assets.
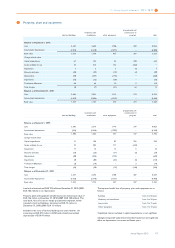
12 Other non-current assets
Other non-current assets in 2010 are comprised of prepaid pension
costs of EUR 14 million (2009: EUR 1,518 million) and prepaid expenses
of EUR 61 million (2009: EUR 25 million).
The decrease of the prepaid pension cost in 2010 is attributable to the
pension plan in the Netherlands, the surplus of which no longer is
recognized as an asset. For further details see note 28.
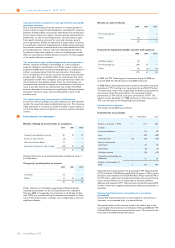
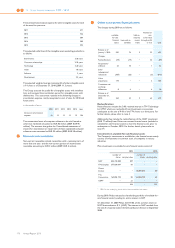
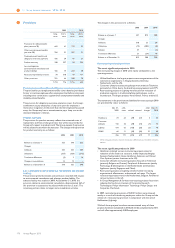
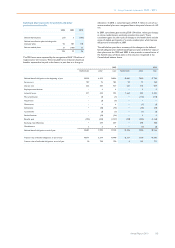
13 Inventories
Inventories are summarized as follows:
2009 2010
Raw materials and supplies 871 1,131
Work in process 408 510
Finished goods 1,634 2,224
2,913 3,865
The amounts recorded above are net of allowances for obsolescence.
In 2010, the write-down of inventories to net realizable value amounted
to EUR 228 million (2009: EUR 219 million). The write-down is included
in cost of sales.
14 Current financial assets
Other current financial assets were EUR 5 million as at December 31,
2010 (2009: EUR 191 million). During 2010, two convertible bonds
previously issued to Philips by TPV Technology Limited and CBAY were
redeemed generating a total of EUR 239 million cash inflow. During
2010, a fair value loss of EUR 21 million was recognized in financial
income and expense, mainly related to these instruments.
15 Other current assets
Other current assets include prepaid expenses of EUR 348 million
(2009: EUR 334 million).
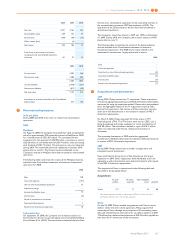
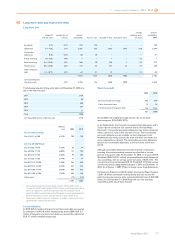
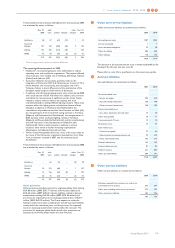
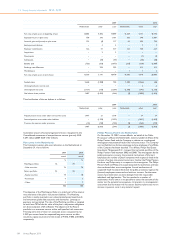
16 Current receivables
The accounts receivable, net, per sector are as follows:
2009 2010
Healthcare 1,571 1,848
Consumer Lifestyle 1,096 1,082
Lighting 909 1,072
Group Management & Services 93 102
3,669 4,104
The aging analysis of accounts receivable, net, is set out below:
2009 2010
current 3,075 3,439
overdue 1-30 days 307 297
overdue 31-180 days 241 283
overdue > 180 days 46 85
3,669 4,104
A large part of overdue trade accounts receivable relates to public
sector customers with slow payment approval processes. The
allowance for doubtful accounts receivable has been primarily
established for receivables that are past due.