Philips 2010 Annual Report Download - page 60
Download and view the complete annual report
Please find page 60 of the 2010 Philips annual report below. You can navigate through the pages in the report by either clicking on the pages listed below, or by using the keyword search tool below to find specific information within the annual report.-
 1
1 -
2
-
3
-
4
-
5
-
6
-
7
-
8
-
9
-
10
-
11
-
12
-
13
-
14
-
15
-
16
-
17
-
18
-
19
-
20
-
21
-
22
-
23
-
24
-
25
-
26
-
27
-
28
-
29
-
30
-
31
-
32
-
33
-
34
-
35
-
36
-
37
-
38
-
39
-
40
-
41
-
42
-
43
-
44
-
45
-
46
-
47
-
48
-
49
-
 50
50 -
 51
51 -
 52
52 -
 53
53 -
 54
54 -
 55
55 -
 56
56 -
 57
57 -
 58
58 -
 59
59 -
 60
60 -
 61
61 -
 62
62 -
 63
63 -
 64
64 -
 65
65 -
 66
66 -
 67
67 -
 68
68 -
 69
69 -
 70
70 -
71
-
72
-
73
-
74
-
75
-
76
-
77
-
78
-
79
-
80
-
81
-
82
-
83
-
84
-
85
-
86
-
87
-
88
-
89
-
90
-
91
-
92
-
93
-
94
-
95
-
96
-
97
-
98
-
99
-
100
-
101
-
102
-
103
-
104
-
105
-
106
-
107
-
108
-
109
-
110
-
111
-
112
-
113
-
114
-
115
-
116
-
117
-
118
-
119
-
120
-
121
-
122
-
123
-
124
-
125
-
126
-
127
-
128
-
129
-
130
-
131
-
132
-
133
-
134
-
135
-
136
-
137
-
138
-
139
-
140
-
141
-
142
-
143
-
144
-
145
-
146
-
147
-
148
-
149
-
150
-
151
-
152
-
153
-
154
-
155
-
156
-
157
-
158
-
159
-
160
-
161
-
162
-
163
-
164
-
165
-
166
-
167
-
168
-
169
-
170
-
171
-
172
-
173
-
174
-
175
-
176
-
177
-
178
-
179
-
180
-
181
-
182
-
183
-
184
-
185
-
186
-
187
-
188
-
189
-
190
-
191
-
192
-
193
-
194
-
195
-
196
-
197
-
198
-
199
-
200
-
201
-
202
-
203
-
204
-
205
-
206
-
207
-
208
-
209
-
210
-
211
-
212
-
213
-
214
-
215
-
216
-
217
-
218
-
219
-
220
-
221
-
222
-
223
-
224
-
225
-
226
-
227
-
228
-
229
-
230
-
231
-
232
-
233
-
234
-
235
-
236
-
237
-
238
-
239
-
240
-
241
-
242
-
243
-
244
-
245
-
246
-
247
-
248
-
249
-
250
 |
 |

5 Group performance 5.1.1 - 5.1.2
60 Annual Report 2010
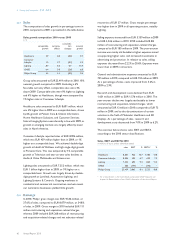
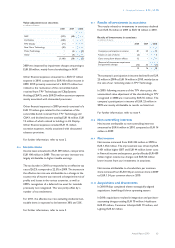
5.1.1 Sales
The composition of sales growth in percentage terms in
2010, compared to 2009, is presented in the table below.
Sales growth composition 2010 versus 2009
in %
comparable
growth currency
effects
consolida-
tion
changes nominal
growth
Healthcare 3.9 6.0 (0.2) 9.7
Consumer
Lifestyle 1.2 4.7 (0.7) 5.2
Lighting 8.7 6.0 0.7 15.4
GM&S 6.4 3.0 (2.6) 6.8
Philips Group 4.3 5.5 (0.2) 9.6
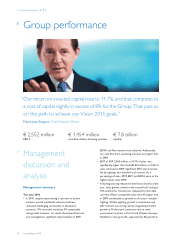
Group sales amounted to EUR 25,419 million in 2010, 10%
nominal growth compared to 2009. Excluding a 6%
favorable currency effect, comparable sales were 4%
above 2009. Comparable sales were 9% higher at Lighting
and 4% higher at Healthcare, though were tempered by
1% higher sales at Consumer Lifestyle.
Healthcare sales amounted to EUR 8,601 million, which
was 4% higher than in 2009 on a comparable basis, driven
by 6% growth at Patient Care & Clinical Informatics,
Home Healthcare Solutions, and Customer Services.
Sales at Imaging Systems were broadly in line with 2009, as
growth in emerging markets was largely offset by lower
sales in North America.
Consumer Lifestyle reported sales of EUR 8,906 million,
which was EUR 439 million higher than in 2009, or 1%
higher on a comparable basis. We achieved double-digit
growth at Health & Wellness and high single-digit growth
at Personal Care. This was tempered by 1% comparable
growth at Television and year-on-year sales declines at
Audio & Video Multimedia and Accessories.
Lighting sales amounted to EUR 7,552 million, which was
EUR 1 billion higher than in 2009, or 9% higher on a
comparable basis. Growth was largely driven by double-
digit growth at Lumileds, Automotive Lighting, and
Lighting Systems & Controls. Ongoing weakness in
residential and commercial construction markets meant
our Luminaires businesses yielded little growth.
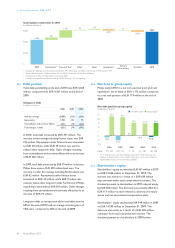
5.1.2 Earnings
In 2010, Philips’ gross margin was EUR 9,546 million, or
37.6% of sales, compared to EUR 8,079 million, or 34.8%
of sales, in 2009. Gross margin in 2010 included EUR 111
million restructuring and acquisition-related charges,
whereas 2009 included EUR 268 million of restructuring
and acquisition-related charges and net asbestos-related
recoveries of EUR 57 million. Gross margin percentage
was higher than in 2009 in all operating sectors, notably
Lighting.
Selling expenses increased from EUR 5,159 million in 2009
to EUR 5,246 million in 2010. 2010 included EUR 88
million of restructuring and acquisition-related charges,
compared to EUR 185 million in 2009. The year-on-year
increase was mainly attributable to higher expenses aimed
at supporting higher sales, and increased investments in
advertising and promotion. In relation to sales, selling
expenses decreased from 22.2% to 20.6%. Expenses were
lower than in 2009 in all sectors.
General and administrative expenses amounted to EUR
735 million in 2010, compared to EUR 734 million in 2009.
As a percentage of sales, costs improved from 3.2% in
2009 to 2.9%.
Research and development costs declined from EUR
1,631 million in 2009 to EUR 1,576 million in 2010. The
year-on-year decline was largely attributable to lower
restructuring and acquisition-related charges, which
amounted to EUR 13 million in 2010, compared to EUR 73
million in 2009, and to the discontinuation of certain
activities in the field of Molecular Healthcare and 3D
Displays. As a percentage of sales, research and
development costs decreased from 7.0% in 2009 to 6.2%.
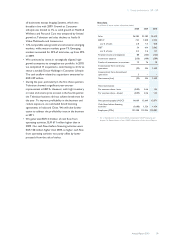
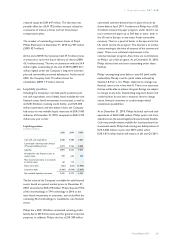
The overview below shows sales, EBIT and EBITA
according to the 2010 sector classifications.
Sales, EBIT and EBITA 2010
in millions of euros unless otherwise stated
sales EBIT % EBITA1) %
Healthcare 8,601 922 10.7 1,186 13.8
Consumer Lifestyle 8,906 595 6.7 639 7.2
Lighting 7,552 695 9.2 869 11.5
GM&S 360 (147) − (142) −
Philips Group 25,419 2,065 8.1 2,552 10.0
1) For a reconciliation to the most directly comparable GAAP measures, see
chapter 16, Reconciliation of non-GAAP information, of this Annual Report