Philips 2010 Annual Report Download - page 173
Download and view the complete annual report
Please find page 173 of the 2010 Philips annual report below. You can navigate through the pages in the report by either clicking on the pages listed below, or by using the keyword search tool below to find specific information within the annual report.-
 1
1 -
2
-
3
-
4
-
5
-
6
-
7
-
8
-
9
-
10
-
11
-
12
-
13
-
14
-
15
-
16
-
17
-
18
-
19
-
20
-
21
-
22
-
23
-
24
-
25
-
26
-
27
-
28
-
29
-
30
-
31
-
32
-
33
-
34
-
35
-
36
-
37
-
38
-
39
-
40
-
41
-
42
-
43
-
44
-
45
-
46
-
47
-
48
-
49
-
50
-
51
-
52
-
53
-
54
-
55
-
56
-
57
-
58
-
59
-
60
-
61
-
62
-
63
-
64
-
65
-
66
-
67
-
68
-
69
-
70
-
71
-
72
-
73
-
74
-
75
-
76
-
77
-
78
-
79
-
80
-
81
-
82
-
83
-
84
-
85
-
86
-
87
-
88
-
89
-
90
-
91
-
92
-
93
-
94
-
95
-
96
-
97
-
98
-
99
-
100
-
101
-
102
-
103
-
104
-
105
-
106
-
107
-
108
-
109
-
110
-
111
-
112
-
113
-
114
-
115
-
116
-
117
-
118
-
119
-
120
-
121
-
122
-
123
-
124
-
125
-
126
-
127
-
128
-
129
-
130
-
131
-
132
-
133
-
134
-
135
-
136
-
137
-
138
-
139
-
140
-
141
-
142
-
143
-
144
-
145
-
146
-
147
-
148
-
149
-
150
-
151
-
152
-
153
-
154
-
155
-
156
-
157
-
158
-
159
-
160
-
161
-
162
-
 163
163 -
 164
164 -
 165
165 -
 166
166 -
 167
167 -
 168
168 -
 169
169 -
 170
170 -
 171
171 -
 172
172 -
 173
173 -
 174
174 -
 175
175 -
 176
176 -
 177
177 -
 178
178 -
 179
179 -
 180
180 -
 181
181 -
 182
182 -
 183
183 -
184
-
185
-
186
-
187
-
188
-
189
-
190
-
191
-
192
-
193
-
194
-
195
-
196
-
197
-
198
-
199
-
200
-
201
-
202
-
203
-
204
-
205
-
206
-
207
-
208
-
209
-
210
-
211
-
212
-
213
-
214
-
215
-
216
-
217
-
218
-
219
-
220
-
221
-
222
-
223
-
224
-
225
-
226
-
227
-
228
-
229
-
230
-
231
-
232
-
233
-
234
-
235
-
236
-
237
-
238
-
239
-
240
-
241
-
242
-
243
-
244
-
245
-
246
-
247
-
248
-
249
-
250
 |
 |
13 Group financial statements 13.11 - 13.11 9
Annual Report 2010 173
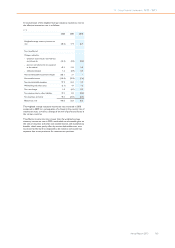
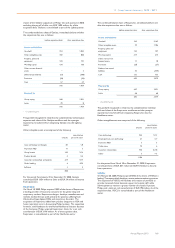
The following changes could, individually, cause the value in use to fall to
the level of the carrying value:
increase in
pre-tax
discount rate,
basis points
decrease in
long-term
growth rate,
basis points
decrease in
terminal value
amount, %
Respiratory Care and Sleep
Management 30 50 5
Professional Luminaires 250 280 34
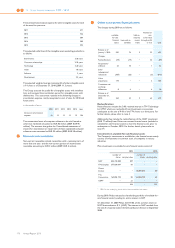
The results of the annual impairment test of Imaging Systems and
Patient Care & Clinical Informatics have indicated that a reasonably
possible change in key assumptions would not cause the value in use to
fall to the level of the carrying value.
Based on the Q4 trigger-based impairment test, it was noted that the
headroom for the cash-generating unit Home Monitoring was EUR 26
million. An increase of 34 basis points in pre-tax discounting rate, a 50
basis points decline in the compound long term sales growth rate or a
6% decrease in terminal value would cause its value in use to fall to the
level of its carrying value. The goodwill allocated to Home Monitoring at
December 31, 2010 amounts to EUR 450 million.
Please refer to section 13.9, Information by sector and main country, of
this Annual Report for a specification of goodwill by sector.
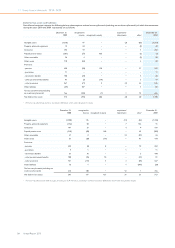
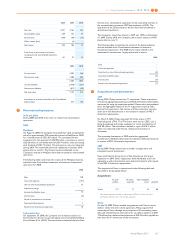
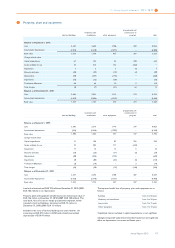
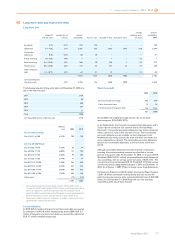
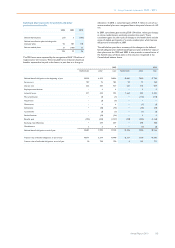
9Intangible assets excluding goodwill
The changes were as follows:
other intangible
assets product
development software total
Balance as of
January 1, 2010:
Cost 5,040 820 606 6,466
Accumulated
amortization (1,484) (436) (385) (2,305)
Book value 3,556 384 221 4,161
Changes in
book value:
Additions 64 219 76 359
Acquisitions
and purchase
price allocation
adjustments 131 (13) 1 119
Amortization/
deductions (484) (155) (89) (728)
Impairment
losses (3) (13) − (16)
Translation
differences 268 17 11 296
Other (2) 20 (11) 7
Total changes (26) 75 (12) 37
Balance as of
December 31,
2010:
Cost 5,486 1,046 665 7,197
Accumulated
amortization (1,956) (587) (456) (2,999)
Book Value 3,530 459 209 4,198
other intangible
assets product
development software total
Balance as of
January 1, 2009:
Cost 5,021 805 702 6,528
Accumulated
amortization (1,137) (448) (466) (2,051)
Book value 3,884 357 236 4,477
Changes in
book value:
Additions 14 188 91 293
Acquisitions
and purchase
price allocation
adjustments 102 25 − 127
Amortization/
deductions (433) (165) (103) (701)
Impairment
losses (3) (16) (3) (22)
Translation
differences (18) (4) − (22)
Other 10 (1) − 9
Total changes (328) 27 (15) (316)
Balance as of
December 31,
2009:
Cost 5,040 820 606 6,466
Accumulated
amortization (1,484) (436) (385) (2,305)
Book Value 3,556 384 221 4,161
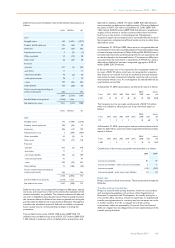
The additions for 2010 contain internally generated assets of EUR 219
million and EUR 70 million for product development and software,
respectively (2009: EUR 188 million, EUR 76 million).
The acquisitions through business combinations in 2010 consist of the
acquired intangible assets of Discus Holdings, Inc. for EUR 67 million
and several other smaller acquisitions. The acquisitions through
business combinations in 2009 mainly consist of the acquired intangible
assets of Saeco for EUR 74 million.
The amortization of Intangible assets is specified in note 1.
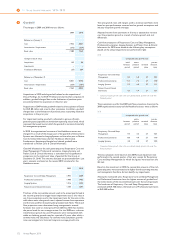
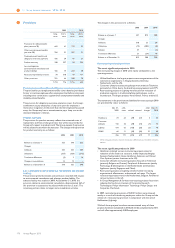
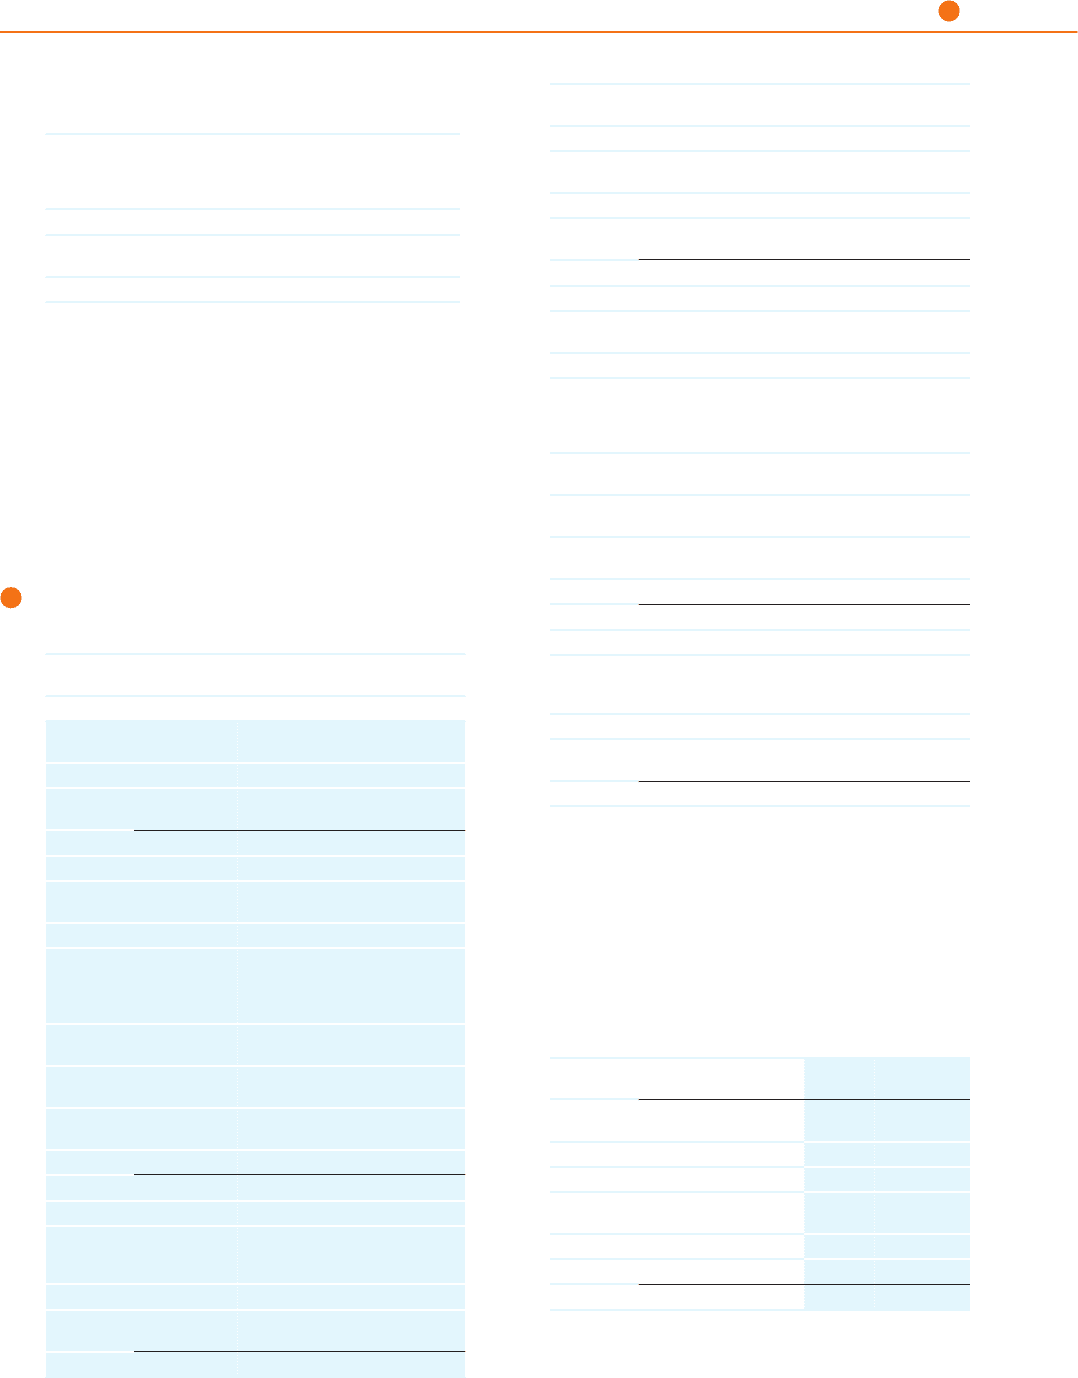
Other intangible assets consist of:
December 31,
2009 December 31,
2010
gross accumulated
amortization gross accumulated
amortization
Brand names 939 (212) 843 (206)
Customer
relationships 2,581 (534) 2,839 (762)
Technology 1,472 (712) 1,743 (948)
Other 48 (26) 61 (40)
5,040 (1,484) 5,486 (1,956)