Philips 2010 Annual Report Download - page 188
Download and view the complete annual report
Please find page 188 of the 2010 Philips annual report below. You can navigate through the pages in the report by either clicking on the pages listed below, or by using the keyword search tool below to find specific information within the annual report.-
 1
1 -
2
-
3
-
4
-
5
-
6
-
7
-
8
-
9
-
10
-
11
-
12
-
13
-
14
-
15
-
16
-
17
-
18
-
19
-
20
-
21
-
22
-
23
-
24
-
25
-
26
-
27
-
28
-
29
-
30
-
31
-
32
-
33
-
34
-
35
-
36
-
37
-
38
-
39
-
40
-
41
-
42
-
43
-
44
-
45
-
46
-
47
-
48
-
49
-
50
-
51
-
52
-
53
-
54
-
55
-
56
-
57
-
58
-
59
-
60
-
61
-
62
-
63
-
64
-
65
-
66
-
67
-
68
-
69
-
70
-
71
-
72
-
73
-
74
-
75
-
76
-
77
-
78
-
79
-
80
-
81
-
82
-
83
-
84
-
85
-
86
-
87
-
88
-
89
-
90
-
91
-
92
-
93
-
94
-
95
-
96
-
97
-
98
-
99
-
100
-
101
-
102
-
103
-
104
-
105
-
106
-
107
-
108
-
109
-
110
-
111
-
112
-
113
-
114
-
115
-
116
-
117
-
118
-
119
-
120
-
121
-
122
-
123
-
124
-
125
-
126
-
127
-
128
-
129
-
130
-
131
-
132
-
133
-
134
-
135
-
136
-
137
-
138
-
139
-
140
-
141
-
142
-
143
-
144
-
145
-
146
-
147
-
148
-
149
-
150
-
151
-
152
-
153
-
154
-
155
-
156
-
157
-
158
-
159
-
160
-
161
-
162
-
163
-
164
-
165
-
166
-
167
-
168
-
169
-
170
-
171
-
172
-
173
-
174
-
175
-
176
-
177
-
 178
178 -
 179
179 -
 180
180 -
 181
181 -
 182
182 -
 183
183 -
 184
184 -
 185
185 -
 186
186 -
 187
187 -
 188
188 -
 189
189 -
 190
190 -
 191
191 -
 192
192 -
 193
193 -
 194
194 -
 195
195 -
 196
196 -
 197
197 -
 198
198 -
199
-
200
-
201
-
202
-
203
-
204
-
205
-
206
-
207
-
208
-
209
-
210
-
211
-
212
-
213
-
214
-
215
-
216
-
217
-
218
-
219
-
220
-
221
-
222
-
223
-
224
-
225
-
226
-
227
-
228
-
229
-
230
-
231
-
232
-
233
-
234
-
235
-
236
-
237
-
238
-
239
-
240
-
241
-
242
-
243
-
244
-
245
-
246
-
247
-
248
-
249
-
250
 |
 |

13 Group financial statements 13.11 - 13.11
188 Annual Report 2010
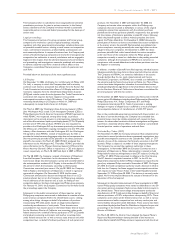
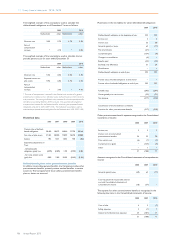
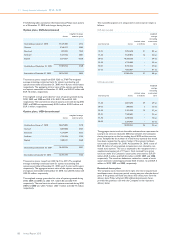
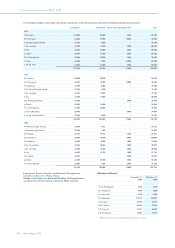
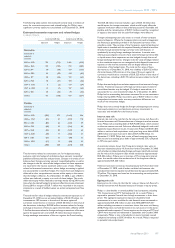
The following tables summarize information about Philips stock options
as of December 31, 2010 and changes during the year:
Option plans, EUR-denominated
shares weighted average
exercise price
Outstanding at January 1, 2010 35,375,485 27.16
Granted 3,246,371 24.83
Exercised 829,333 19.53
Forfeited 3,373,736 28.01
Expired 2,614,431 43.58
Outstanding at December 31, 2010 31,804,356 25.68
Exercisable at December 31, 2010 20,756,362 28.22
The exercise prices range from EUR 12.63 to 37.60 The weighted
average remaining contractual term for options outstanding and
options exercisable at December 31, 2010, was 4.8 years and 3.0 years,
respectively. The aggregate intrinsic value of the options outstanding
and options exercisable at December 31, 2010, was EUR 47 million and
EUR 16 million, respectively.
The weighted average grant-date fair value of options granted during
2010, 2009, and 2008 was EUR 4.95, EUR 2.78 and EUR 5.69,
respectively. The total intrinsic value of options exercised during 2010,
2009, and 2008 was approximately EUR 6 million, EUR 0 million and
EUR 1 million, respectively.
Option plans, USD-denominated
shares weighted average
exercise price
Outstanding at January 1, 2010 20,675,005 31.10
Granted 2,059,830 33.35
Exercised 1,170,594 26.22
Forfeited 1,335,556 31.45
Expired 1,808,131 42.60
Outstanding at December 31, 2010 18,420,554 30.51
Exercisable at December 31, 2010 10,701,593 31.22
The exercise prices range from USD 16.41 to 44.15 The weighted
average remaining contractual term for options outstanding and
options exercisable at December 31, 2010, was 5.5 years and 3.6 years,
respectively. The aggregate intrinsic value of the options outstanding
and options exercisable at December 31, 2010, was USD 56 million and
USD 24 million, respectively.
The weighted average grant-date fair value of options granted during
2010, 2009 and 2008 was USD 7.71, USD 3.83 and USD 7.97,
respectively. The total intrinsic value of options exercised during 2010,
2009 and 2008 was USD 7 million, USD 1 million and USD 13 million,
respectively.
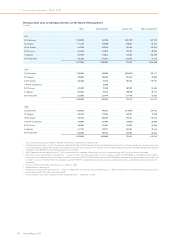
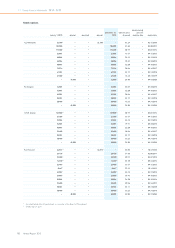
The outstanding options are categorized in exercise price ranges as
follows:
EUR-denominated
exercise price shares intrinsic value
in millions
weighted
average
remaining
contractual
term
10-15 2,994,618 31 8.3 yrs
15-20 3,520,872 16 3.6 yrs
20-25 10,350,730 − 6.9 yrs
25-30 4,718,489 − 3.4 yrs
30-35 8,346,556 − 3.2 yrs
35-55 1,873,091 − 0.1 yrs
31,804,356 47 4.8 yrs
USD-denominated
exercise price shares intrinsic value
in millions
weighted
average
remaining
contractual
term
15-20 2,864,670 39 6.9 yrs
20-25 380,635 3 1.6 yrs
25-30 3,353,104 14 3.1 yrs
30-35 7,368,684 − 5.4 yrs
35-40 2,248,560 − 7.2 yrs
40-50 2,204,901 − 6.3 yrs
18,420,554 56 5.5 yrs
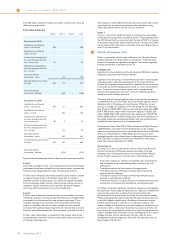
The aggregate intrinsic value in the tables and text above represents the
total pre-tax intrinsic value (the difference between the Company’s
closing share price on the last trading day of 2010 and the exercise
price, multiplied by the number of in-the-money options) that would
have been received by the option holders if the options had been
exercised on December 31, 2010. At December 31, 2010, a total of
EUR 30 million of unrecognized compensation cost related to non-
vested stock options. This cost is expected to be recognized over a
weighted-average period of 1.9 years. Cash received from option
exercises under the Company’s option plans amounted to EUR 39
million, EUR 4 million and EUR 24 million in 2010, 2009, and 2008,
respectively. The actual tax deductions realized as a result of stock
option exercises totaled approximately EUR 2 million, nil and EUR 3
million, in 2010, 2009, and 2008, respectively.
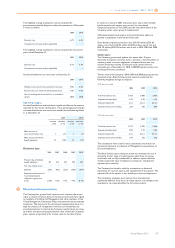
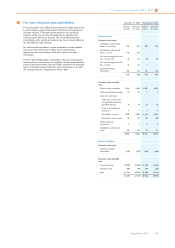
Restricted shares plans
The Company issues restricted share rights that vest in equal annual
installments over a three-year period, starting one year after the date of
grant. If the grantee still holds the shares after three years from the
delivery date, Philips will grant 20% additional (premium) shares,
provided the grantee is still with the Company on the respective
delivery dates.