Philips 2010 Annual Report Download - page 127
Download and view the complete annual report
Please find page 127 of the 2010 Philips annual report below. You can navigate through the pages in the report by either clicking on the pages listed below, or by using the keyword search tool below to find specific information within the annual report.-
 1
1 -
2
-
3
-
4
-
5
-
6
-
7
-
8
-
9
-
10
-
11
-
12
-
13
-
14
-
15
-
16
-
17
-
18
-
19
-
20
-
21
-
22
-
23
-
24
-
25
-
26
-
27
-
28
-
29
-
30
-
31
-
32
-
33
-
34
-
35
-
36
-
37
-
38
-
39
-
40
-
41
-
42
-
43
-
44
-
45
-
46
-
47
-
48
-
49
-
50
-
51
-
52
-
53
-
54
-
55
-
56
-
57
-
58
-
59
-
60
-
61
-
62
-
63
-
64
-
65
-
66
-
67
-
68
-
69
-
70
-
71
-
72
-
73
-
74
-
75
-
76
-
77
-
78
-
79
-
80
-
81
-
82
-
83
-
84
-
85
-
86
-
87
-
88
-
89
-
90
-
91
-
92
-
93
-
94
-
95
-
96
-
97
-
98
-
99
-
100
-
101
-
102
-
103
-
104
-
105
-
106
-
107
-
108
-
109
-
110
-
111
-
112
-
113
-
114
-
115
-
116
-
 117
117 -
 118
118 -
 119
119 -
 120
120 -
 121
121 -
 122
122 -
 123
123 -
 124
124 -
 125
125 -
 126
126 -
 127
127 -
 128
128 -
 129
129 -
 130
130 -
 131
131 -
 132
132 -
 133
133 -
 134
134 -
 135
135 -
 136
136 -
 137
137 -
138
-
139
-
140
-
141
-
142
-
143
-
144
-
145
-
146
-
147
-
148
-
149
-
150
-
151
-
152
-
153
-
154
-
155
-
156
-
157
-
158
-
159
-
160
-
161
-
162
-
163
-
164
-
165
-
166
-
167
-
168
-
169
-
170
-
171
-
172
-
173
-
174
-
175
-
176
-
177
-
178
-
179
-
180
-
181
-
182
-
183
-
184
-
185
-
186
-
187
-
188
-
189
-
190
-
191
-
192
-
193
-
194
-
195
-
196
-
197
-
198
-
199
-
200
-
201
-
202
-
203
-
204
-
205
-
206
-
207
-
208
-
209
-
210
-
211
-
212
-
213
-
214
-
215
-
216
-
217
-
218
-
219
-
220
-
221
-
222
-
223
-
224
-
225
-
226
-
227
-
228
-
229
-
230
-
231
-
232
-
233
-
234
-
235
-
236
-
237
-
238
-
239
-
240
-
241
-
242
-
243
-
244
-
245
-
246
-
247
-
248
-
249
-
250
 |
 |

11 Supervisory Board report 11.2.6 - 11.2.6
Annual Report 2010 127
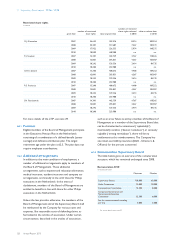
Electric, Hitachi, Honeywell International, Johnson &
Johnson, Matsushita, Philips, Schneider, Siemens, Toshiba
and 3M.
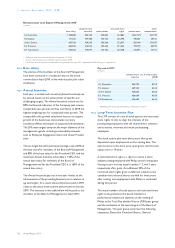
The TSR ranking is the basis for the two different
multipliers that apply to the grant of stock options and
restricted share rights. The multipliers are determined in
line with the table below.
TSR multiplier
Philips’ position ranking 1 2 3 4 5 6
restricted share rights 2.0 1.8 1.6 1.4 1.2 1.0
stock options 1.2 1.2 1.2 1.2 1.0 1.0
TSR multiplier
Philips’ position ranking 7 8 9 10 11 12
restricted share rights 1.0 0.8 0.6 0.4 0.2 0.0
stock options 1.0 1.0 0.8 0.8 0.8 0.8
Based on Philips’ share performance over the period
December 2006 - December 2009, Philips ranked 9th in its
peer group.
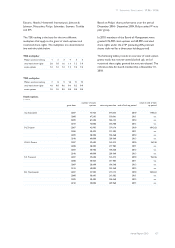
In 2010, members of the Board of Management were
granted 276,000 stock options and 69,000 restricted
share rights under the LTIP (excluding 20% premium
shares deferred for a three-year holding period).
The following tables provide an overview of stock option
grants made, but not yet vested (locked up), and of
restricted share rights granted but not yet released. The
reference date for board membership is December 31,
2010.
Stock options
in euros
grant date number of stock
options value at grant date end of lock up period value at end of lock
up period
G.J. Kleisterlee 2007 73,926 644,635 2010 179,655
2008 67,203 370,961 2011 n.a.
2009 67,200 186,144 2012 n.a.
2010 72,000 356,400 2013 n.a.
P-J. Sivignon 2007 42,903 374,114 2010 104,263
2008 38,403 211,985 2011 n.a.
2009 38,400 106,368 2012 n.a.
2010 40,800 201,960 2013 n.a.
G.H.A. Dutiné 2007 39,600 345,312 2010 96,236
2008 38,403 211,985 2011 n.a.
2009 38,400 106,368 2012 n.a.
2010 40,800 201,960 2013 n.a.
R.S. Provoost 2007 39,600 345,312 2010 96,236
2008 38,403 211,985 2011 n.a.
2009 38,400 106,368 2012 n.a.
2010 40,800 201,960 2013 n.a.
S.H. Rusckowski 2007 42,903 374,114 2010 104,263
2008 38,403 211,985 2011 n.a.
2009 38,400 106,368 2012 n.a.
2010 40,800 201,960 2013 n.a.