Philips 2010 Annual Report Download - page 183
Download and view the complete annual report
Please find page 183 of the 2010 Philips annual report below. You can navigate through the pages in the report by either clicking on the pages listed below, or by using the keyword search tool below to find specific information within the annual report.-
 1
1 -
2
-
3
-
4
-
5
-
6
-
7
-
8
-
9
-
10
-
11
-
12
-
13
-
14
-
15
-
16
-
17
-
18
-
19
-
20
-
21
-
22
-
23
-
24
-
25
-
26
-
27
-
28
-
29
-
30
-
31
-
32
-
33
-
34
-
35
-
36
-
37
-
38
-
39
-
40
-
41
-
42
-
43
-
44
-
45
-
46
-
47
-
48
-
49
-
50
-
51
-
52
-
53
-
54
-
55
-
56
-
57
-
58
-
59
-
60
-
61
-
62
-
63
-
64
-
65
-
66
-
67
-
68
-
69
-
70
-
71
-
72
-
73
-
74
-
75
-
76
-
77
-
78
-
79
-
80
-
81
-
82
-
83
-
84
-
85
-
86
-
87
-
88
-
89
-
90
-
91
-
92
-
93
-
94
-
95
-
96
-
97
-
98
-
99
-
100
-
101
-
102
-
103
-
104
-
105
-
106
-
107
-
108
-
109
-
110
-
111
-
112
-
113
-
114
-
115
-
116
-
117
-
118
-
119
-
120
-
121
-
122
-
123
-
124
-
125
-
126
-
127
-
128
-
129
-
130
-
131
-
132
-
133
-
134
-
135
-
136
-
137
-
138
-
139
-
140
-
141
-
142
-
143
-
144
-
145
-
146
-
147
-
148
-
149
-
150
-
151
-
152
-
153
-
154
-
155
-
156
-
157
-
158
-
159
-
160
-
161
-
162
-
163
-
164
-
165
-
166
-
167
-
168
-
169
-
170
-
171
-
172
-
 173
173 -
 174
174 -
 175
175 -
 176
176 -
 177
177 -
 178
178 -
 179
179 -
 180
180 -
 181
181 -
 182
182 -
 183
183 -
 184
184 -
 185
185 -
 186
186 -
 187
187 -
 188
188 -
 189
189 -
 190
190 -
 191
191 -
 192
192 -
 193
193 -
194
-
195
-
196
-
197
-
198
-
199
-
200
-
201
-
202
-
203
-
204
-
205
-
206
-
207
-
208
-
209
-
210
-
211
-
212
-
213
-
214
-
215
-
216
-
217
-
218
-
219
-
220
-
221
-
222
-
223
-
224
-
225
-
226
-
227
-
228
-
229
-
230
-
231
-
232
-
233
-
234
-
235
-
236
-
237
-
238
-
239
-
240
-
241
-
242
-
243
-
244
-
245
-
246
-
247
-
248
-
249
-
250
 |
 |

13 Group financial statements 13.11 - 13.11
Annual Report 2010 183
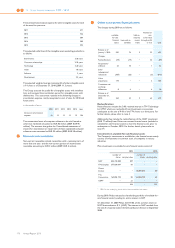
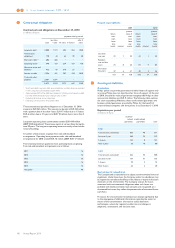
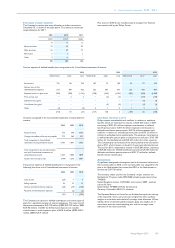
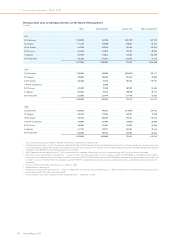
Summary of pre-tax costs for pensions and other
postretirement benefits
2008 2009 2010
Defined-benefit plans (21) 3 (103)
Defined-contribution plans including multi-
employer plans 96 107 118
Retiree medical plans 31 (100) 11
106 10 26
The 2010 costs were impacted by the recognition of EUR 119 million of
negative prior service costs. These resulted from a reduction of pension
benefits expected to be paid in the future, in part due to a change in
indexation. In 2010, a curtailment gain of EUR 9 million in one of our
retiree medical plans was recognized due to the partial closure of a US
site.
In 2009, curtailment gains totaling EUR 134 million, relating to changes
in retiree medical plans, positively impacted the result. These
curtailment gains are the result of changes in the benefit level and the
scope of eligible participants of a retiree medical plan, which became
effective and irreversible in 2009.
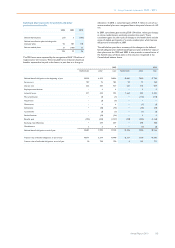
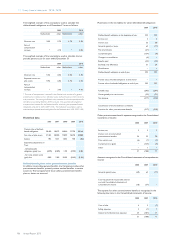
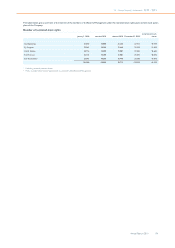
The table below provides a summary of the changes in the defined-
benefit obligations for defined-benefit pension plans and the fair value of
their plan assets for 2010 and 2009. It also provides a reconciliation of
the funded status of these plans to the amounts recognized in the
Consolidated balance sheets.
2009 2010
Netherlands other total Netherlands other total
Defined-benefit obligation at the beginning of year 10,394 6,452 16,846 10,681 7,039 17,720
Service cost 107 75 182 92 77 169
Interest cost 532 395 927 521 418 939
Employee contributions − 4 4 − 3 3
Actuarial losses 371 424 795 1,662 593 2,255
Plan amendments − (7) (7) − (113) (113)
Acquisitions − (3) (3) − − −
Divestments − 4 4 − (1) (1)
Settlements − (95) (95) − (44) (44)
Curtailments − (5) (5) − (1) (1)
Reclassifications − (34) (34) − 5 5
Benefits paid (725) (422) (1,147) (730) (432) (1,162)
Exchange rate differences − 249 249 − 398 398
Miscellaneous 2 2 4 − (2) (2)
Defined-benefit obligation at end of year 10,681 7,039 17,720 12,226 7,940 20,166
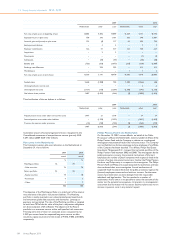
Present value of funded obligations at end of year 10,671 6,319 16,990 12,217 7,178 19,395
Present value of unfunded obligations at end of year 10 720 730 9 762 771