Philips 2010 Annual Report Download - page 162
Download and view the complete annual report
Please find page 162 of the 2010 Philips annual report below. You can navigate through the pages in the report by either clicking on the pages listed below, or by using the keyword search tool below to find specific information within the annual report.-
 1
1 -
2
-
3
-
4
-
5
-
6
-
7
-
8
-
9
-
10
-
11
-
12
-
13
-
14
-
15
-
16
-
17
-
18
-
19
-
20
-
21
-
22
-
23
-
24
-
25
-
26
-
27
-
28
-
29
-
30
-
31
-
32
-
33
-
34
-
35
-
36
-
37
-
38
-
39
-
40
-
41
-
42
-
43
-
44
-
45
-
46
-
47
-
48
-
49
-
50
-
51
-
52
-
53
-
54
-
55
-
56
-
57
-
58
-
59
-
60
-
61
-
62
-
63
-
64
-
65
-
66
-
67
-
68
-
69
-
70
-
71
-
72
-
73
-
74
-
75
-
76
-
77
-
78
-
79
-
80
-
81
-
82
-
83
-
84
-
85
-
86
-
87
-
88
-
89
-
90
-
91
-
92
-
93
-
94
-
95
-
96
-
97
-
98
-
99
-
100
-
101
-
102
-
103
-
104
-
105
-
106
-
107
-
108
-
109
-
110
-
111
-
112
-
113
-
114
-
115
-
116
-
117
-
118
-
119
-
120
-
121
-
122
-
123
-
124
-
125
-
126
-
127
-
128
-
129
-
130
-
131
-
132
-
133
-
134
-
135
-
136
-
137
-
138
-
139
-
140
-
141
-
142
-
143
-
144
-
145
-
146
-
147
-
148
-
149
-
150
-
151
-
 152
152 -
 153
153 -
 154
154 -
 155
155 -
 156
156 -
 157
157 -
 158
158 -
 159
159 -
 160
160 -
 161
161 -
 162
162 -
 163
163 -
 164
164 -
 165
165 -
 166
166 -
 167
167 -
 168
168 -
 169
169 -
 170
170 -
 171
171 -
 172
172 -
173
-
174
-
175
-
176
-
177
-
178
-
179
-
180
-
181
-
182
-
183
-
184
-
185
-
186
-
187
-
188
-
189
-
190
-
191
-
192
-
193
-
194
-
195
-
196
-
197
-
198
-
199
-
200
-
201
-
202
-
203
-
204
-
205
-
206
-
207
-
208
-
209
-
210
-
211
-
212
-
213
-
214
-
215
-
216
-
217
-
218
-
219
-
220
-
221
-
222
-
223
-
224
-
225
-
226
-
227
-
228
-
229
-
230
-
231
-
232
-
233
-
234
-
235
-
236
-
237
-
238
-
239
-
240
-
241
-
242
-
243
-
244
-
245
-
246
-
247
-
248
-
249
-
250
 |
 |

2 3 13 Group financial statements 13.11 - 13.11
162 Annual Report 2010
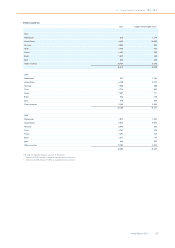
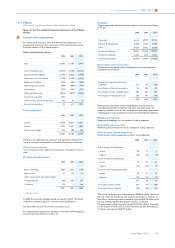
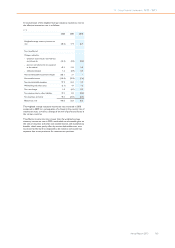
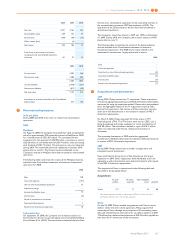
2Financial income and expenses
2008 2009 2010
Interest income 141 45 40
Interest income from loans and receivables 14 18 17
Interest income from cash and cash
equivalents 127 27 23
Dividend income from available for sale
financial assets 25 16 6
Net gains from disposal of financial assets 1,406 126 162
Net change in fair value of financial assets at
fair value through profit or loss − 20 −
Net foreign exchange gains − − 1
Other finance income 22 18 5
Finance income 1,594 225 214
Interest expense (246) (297) (265)
Interest on debts and borrowings (243) (294) (263)
Finance charges under finance lease
contract (3) (3) (2)
Unwind of discount of provisions (25) (15) (20)
Net foreign exchange losses (13) (7) −
Impairment loss of financial assets (1,148) (58) (2)
Net change in fair value of financial assets at
fair value through profit or loss (48) − (21)
Other finance expenses (26) (14) (28)
Finance expense (1,506) (391) (336)
Financial income and expenses 88 (166) (122)
Net financial income and expense was EUR 122 million expense in 2010
which was EUR 44 million lower than in 2009. Total finance income of
EUR 214 million included EUR 162 million gain on the disposal of
financial assets, of which EUR 154 million resulted from the sale of
shares in NXP (please refer to note 11 for more details) and EUR 4
million resulted from the sale of SHL Telemedicine Ltd.. Interest income
from loans and receivables included EUR 15 million related to interest
received on the convertible bonds received from TPV Technology and
CBaySystems Holdings (CBAY). Total finance expense of EUR 336
million included EUR 21 million of losses mainly in relation to fair value
revaluations on the convertible bonds received from TPV Technology
and CBAY prior to their redemption in September and October
respectively.
Net financial income and expense was EUR 166 million expense in 2009,
which was EUR 254 million higher than in 2008. Financial income was
EUR 225 million and included EUR 126 million income from the disposal
of financial assets, including a EUR 69 million gain from the sale of
remaining shares in LG Display, and a EUR 48 million gain from the sale
of remaining shares in Pace Micro Technology. During 2009, Philips had
a net EUR 20 million fair value gain mainly related to the revaluation of
the convertible bonds received from TPV Technology and CBAY.
Philips also received EUR 16 million dividend income, of which EUR 12
million related to holdings in LG Display. Total financial expense was
EUR 391 million, including impairment charges amounting to EUR 58
million mainly from shareholdings in NXP, and EUR 15 million of
accretion expenses mainly associated with discounted asbestos and
environmental provisions.
In 2008, net financial income and expense was EUR 88 million income.
Financial income was EUR 1,594 million and included a EUR 1,406
million net gain from disposal of financial assets, including EUR 1,205
million from the sale of shares in TSMC, a EUR 158 million gain on the
sale of shares in LG Display and EUR 20 million gain on the sale of shares
in D&M. Furthermore, Philips received EUR 25 million of dividend
income, primarily from TSMC. Total finance expense was EUR 1,506
million, including impairment charges amounting to EUR 1,148 million
related to shareholdings in NXP (EUR 599 million), LG Display (EUR
448 million), TPO (EUR 71 million) and Pace Micro Technology (EUR 30
million). Furthermore, there was a net fair value loss of EUR 48 million,
including EUR 37 million from revaluation of the convertible bond
received from TPV Technology.
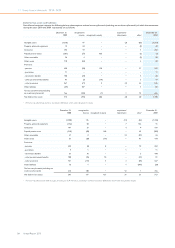
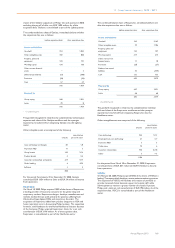
3Income taxes
The tax expense on income before tax amounted to EUR 509 million
(2009: EUR 100 million, 2008: EUR 256 million).
The components of income before taxes and income tax expense are as
follows:
2008 2009 2010
Netherlands 330 175 935
Foreign (188) 273 1,008
Income before taxes 142 448 1,943
Netherlands:
Current taxes 20 (16) (106)
Deferred taxes (120) (72) (144)
(100) (88) (250)
Foreign:
Current taxes (289) (201) (207)
Deferred taxes 133 189 (52)
(156) (12) (259)
Income tax expense (256) (100) (509)
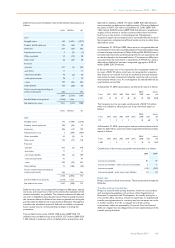
The components of deferred tax expense are as follows:
2008 2009 2010
Previously unrecognized tax loss carried forwards
realized 21 1 9
Current year tax loss carried forwards not realized (98) (60) (55)
Temporary differences (not recognized) recognized (2) 2 (5)
Prior year results (7) 119 (16)
Tax rate changes (1) − (4)
Origination and reversal of temporary differences 100 55 (125)
Deferred tax income (expense) 13 117 (196)
Philips’ operations are subject to income taxes in various foreign
jurisdictions. The statutory income tax rates vary from 10.0% to 40.7%,
which causes a difference between the weighted average statutory
income tax rate and the Netherlands’ statutory income tax rate of
25.5% (2009: 25.5%; 2008: 25.5%).