Philips 2010 Annual Report Download - page 203
Download and view the complete annual report
Please find page 203 of the 2010 Philips annual report below. You can navigate through the pages in the report by either clicking on the pages listed below, or by using the keyword search tool below to find specific information within the annual report.-
 1
1 -
2
-
3
-
4
-
5
-
6
-
7
-
8
-
9
-
10
-
11
-
12
-
13
-
14
-
15
-
16
-
17
-
18
-
19
-
20
-
21
-
22
-
23
-
24
-
25
-
26
-
27
-
28
-
29
-
30
-
31
-
32
-
33
-
34
-
35
-
36
-
37
-
38
-
39
-
40
-
41
-
42
-
43
-
44
-
45
-
46
-
47
-
48
-
49
-
50
-
51
-
52
-
53
-
54
-
55
-
56
-
57
-
58
-
59
-
60
-
61
-
62
-
63
-
64
-
65
-
66
-
67
-
68
-
69
-
70
-
71
-
72
-
73
-
74
-
75
-
76
-
77
-
78
-
79
-
80
-
81
-
82
-
83
-
84
-
85
-
86
-
87
-
88
-
89
-
90
-
91
-
92
-
93
-
94
-
95
-
96
-
97
-
98
-
99
-
100
-
101
-
102
-
103
-
104
-
105
-
106
-
107
-
108
-
109
-
110
-
111
-
112
-
113
-
114
-
115
-
116
-
117
-
118
-
119
-
120
-
121
-
122
-
123
-
124
-
125
-
126
-
127
-
128
-
129
-
130
-
131
-
132
-
133
-
134
-
135
-
136
-
137
-
138
-
139
-
140
-
141
-
142
-
143
-
144
-
145
-
146
-
147
-
148
-
149
-
150
-
151
-
152
-
153
-
154
-
155
-
156
-
157
-
158
-
159
-
160
-
161
-
162
-
163
-
164
-
165
-
166
-
167
-
168
-
169
-
170
-
171
-
172
-
173
-
174
-
175
-
176
-
177
-
178
-
179
-
180
-
181
-
182
-
183
-
184
-
185
-
186
-
187
-
188
-
189
-
190
-
191
-
192
-
 193
193 -
 194
194 -
 195
195 -
 196
196 -
 197
197 -
 198
198 -
 199
199 -
 200
200 -
 201
201 -
 202
202 -
 203
203 -
 204
204 -
 205
205 -
 206
206 -
 207
207 -
 208
208 -
 209
209 -
 210
210 -
 211
211 -
 212
212 -
 213
213 -
214
-
215
-
216
-
217
-
218
-
219
-
220
-
221
-
222
-
223
-
224
-
225
-
226
-
227
-
228
-
229
-
230
-
231
-
232
-
233
-
234
-
235
-
236
-
237
-
238
-
239
-
240
-
241
-
242
-
243
-
244
-
245
-
246
-
247
-
248
-
249
-
250
 |
 |

14 Company financial statements 14.4 - 14.4 A B C D
Annual Report 2010 203
14.4 Notes
All amounts in millions of euros unless otherwise stated
Notes to the Company financial statements
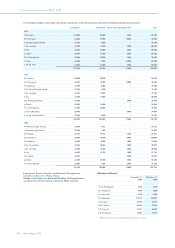
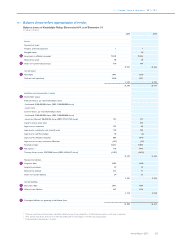
AInvestments in affiliated companies
The investments in affiliated companies (including goodwill) are
presented in the balance sheet based on either their net asset value in
accordance with the aforementioned accounting principles of the
consolidated financial statements, or at amortized cost.
investments
in Group
companies investments
in associates loans1) total
Balance as of January
1, 2010 11,273 70 7,895 19,238
Changes:
Acquisitions/
additions 8,631 3 275 8,909
Sales/redemptions (86) − (7,315) (7,401)
Net income from
affiliated companies 1,250 12 − 1,262
Dividends received (937) (9) − (946)
Translation
differences 454 4 869 1,327
Other (1,333) − − (1,333)
Balance as of
December 31, 2010 19,252 80 1,724 21,056
1) Previous period amounts have been adjusted to reflect changes in the
presentation of intercompany positions with group companies
A list of subsidiaries and affiliated companies, prepared in accordance
with the relevant legal requirements (Dutch Civil Code, Book 2,
Sections 379 and 414), is deposited at the Chamber of Commerce in
Eindhoven, Netherlands.
During 2010 Philips increased its foreign based financial center
activities. In the context of these increased activities, the Company
transferred EUR 7,162 million of its intercompany loans to a foreign
subsidiary. This transfer is expressed under Loans in the line item Sales/
redemptions.
In addition, the Company also provided further funding to this foreign
subsidiary of EUR 1 billion giving a total capital contribution of EUR
8,162 million which is expressed under investments in group companies
in the line item “Acquisitions/additions”.
Included in Other, under Investments in Group companies are actuarial
gains and losses of EUR 1,336 million related to defined-benefit plans of
group companies.
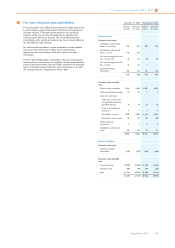
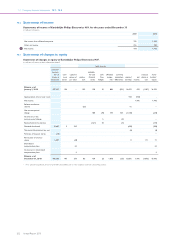
BOther non-current financial assets
available-
for-sale
financial
assets loans and
receivables
financial
assets at
fair value
through
profit and
loss total1)
Balance as of January 1,
2010 369 1 − 370
Changes:
Reclassifications (73) − (4) (77)
Acquisitions/additions 13 2 − 15
Sales/redemptions/
reductions (379) (2) − (381)
Value adjustments 175 − 4 179
Translation and exchange
differences 3 − − 3
Balance as of December
31, 2010 108 1 − 109
1) Prior period insignificant amounts have been reclassified due to new insights in
line with accounting policies
Reclassifications
The CBAY investment (EUR 77 million) was reclassified to Current
financial assets prior to redemption on October 15, 2010.
Investments in available-for-sale financial assets
The Company’s investments in available-for-sale financial assets mainly
consists of investments in common stock of companies in various
industries.
During 2010, Philips reduced its shareholding portfolio of available-for-
sale financial assets by selling its entire stake in NXP Semiconductors
(NXP). Further details on the accounting treatment of NXP are
discussed in note 11.
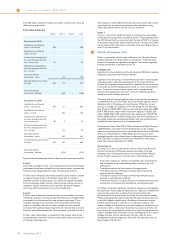
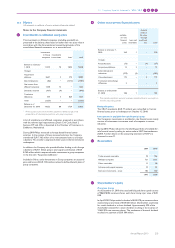
CReceivables
2009 2010
Trade accounts receivable 95 106
Affiliated companies 721 1,261
Other receivables 11 28
Advances and prepaid expenses 33 43
Derivative instruments - assets 183 230
1,043 1,668
DShareholders’ equity
Common shares
As of December 31, 2010, the issued and fully paid share capital consists
of 986,078,784 common shares, each share having a par value of EUR
0.20.
In April 2010, Philips settled a dividend of EUR 0.70 per common share,
representing a total value of EUR 650 million. Shareholders could elect
for a cash dividend or a share dividend. Approximately 53% of the
shareholders elected for a share dividend, resulting in the issuance of
13,667,015 new common shares. The settlement of the cash dividend
resulted in a payment of EUR 304 million.