Philips 2010 Annual Report Download - page 67
Download and view the complete annual report
Please find page 67 of the 2010 Philips annual report below. You can navigate through the pages in the report by either clicking on the pages listed below, or by using the keyword search tool below to find specific information within the annual report.-
 1
1 -
2
-
3
-
4
-
5
-
6
-
7
-
8
-
9
-
10
-
11
-
12
-
13
-
14
-
15
-
16
-
17
-
18
-
19
-
20
-
21
-
22
-
23
-
24
-
25
-
26
-
27
-
28
-
29
-
30
-
31
-
32
-
33
-
34
-
35
-
36
-
37
-
38
-
39
-
40
-
41
-
42
-
43
-
44
-
45
-
46
-
47
-
48
-
49
-
50
-
51
-
52
-
53
-
54
-
55
-
56
-
 57
57 -
 58
58 -
 59
59 -
 60
60 -
 61
61 -
 62
62 -
 63
63 -
 64
64 -
 65
65 -
 66
66 -
 67
67 -
 68
68 -
 69
69 -
 70
70 -
 71
71 -
 72
72 -
 73
73 -
 74
74 -
 75
75 -
 76
76 -
 77
77 -
78
-
79
-
80
-
81
-
82
-
83
-
84
-
85
-
86
-
87
-
88
-
89
-
90
-
91
-
92
-
93
-
94
-
95
-
96
-
97
-
98
-
99
-
100
-
101
-
102
-
103
-
104
-
105
-
106
-
107
-
108
-
109
-
110
-
111
-
112
-
113
-
114
-
115
-
116
-
117
-
118
-
119
-
120
-
121
-
122
-
123
-
124
-
125
-
126
-
127
-
128
-
129
-
130
-
131
-
132
-
133
-
134
-
135
-
136
-
137
-
138
-
139
-
140
-
141
-
142
-
143
-
144
-
145
-
146
-
147
-
148
-
149
-
150
-
151
-
152
-
153
-
154
-
155
-
156
-
157
-
158
-
159
-
160
-
161
-
162
-
163
-
164
-
165
-
166
-
167
-
168
-
169
-
170
-
171
-
172
-
173
-
174
-
175
-
176
-
177
-
178
-
179
-
180
-
181
-
182
-
183
-
184
-
185
-
186
-
187
-
188
-
189
-
190
-
191
-
192
-
193
-
194
-
195
-
196
-
197
-
198
-
199
-
200
-
201
-
202
-
203
-
204
-
205
-
206
-
207
-
208
-
209
-
210
-
211
-
212
-
213
-
214
-
215
-
216
-
217
-
218
-
219
-
220
-
221
-
222
-
223
-
224
-
225
-
226
-
227
-
228
-
229
-
230
-
231
-
232
-
233
-
234
-
235
-
236
-
237
-
238
-
239
-
240
-
241
-
242
-
243
-
244
-
245
-
246
-
247
-
248
-
249
-
250
 |
 |

5 Group performance 5.2.1 - 5.2.4
Annual Report 2010 67
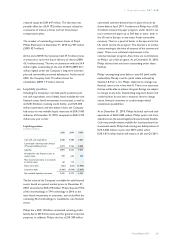
Acquisitions
Net cash impact of acquisitions in 2010 was a total of EUR
239 million, mainly Discus Holdings (EUR 129 million),
NCW Holdings LTD (EUR 13 million) and medSage
Technologies (EUR 14 million).
In 2009, a total of EUR 300 million cash was used for
acquisitions, mainly Saeco (EUR 171 million), Dynalite
(EUR 31 million) and Traxtal (EUR 18 million).
Divestments and derivatives
Cash proceeds of EUR 385 million were received from
divestments, including EUR 98 million from the sale of
9.4% shares in TPV, EUR 165 million and EUR 74 million
from the redemption of the TPV and CBAY convertible
bonds respectively. The transaction related to the sale of
the remaining NXP shares to Philips UK pension fund
which was cash-neutral. Cash flows used for derivatives
led to a EUR 25 million outflow.
In 2009, cash proceeds of EUR 628 million and EUR 76
million were received from the final sale of stakes in LG
Display and Pace Micro Technology respectively. Cash
flows from derivatives and securities led to a net cash
outflow of EUR 39 million.
Cash flows from financing activities
Net cash used for financing activities in 2010 was EUR 96
million. Philips’ shareholders were paid EUR 650 million in
the form of a dividend of which cash dividend amounted to
EUR 296 million. The net impact of changes in debt was an
increase of EUR 135 million, including a EUR 214
million increase from finance lease and bank loans,
partially offset by repayments on short-term debts and
other long-term debt amounting to EUR 79 million.
Additionally, net cash inflows for share delivery totaled
EUR 65 million.
Net cash used for financing activities in 2009 was EUR 545
million. Philips’ shareholders were paid EUR 647 million in
the form of a dividend payment. The net impact of changes
in debt was an increase of EUR 60 million, including the
drawdown of a EUR 250 million loan, EUR 62
million increase from finance lease and bank loans, offset
by repayments on short-term debts and other long-term
debt amounting to EUR 252 million. Additionally, net cash
inflows for share delivery totaled EUR 29 million.
5.2.2 Cash flows from discontinued operations
During 2010 and 2009 there was no cash used for
discontinued operations.
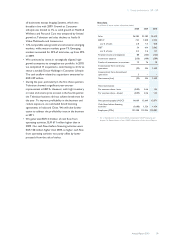
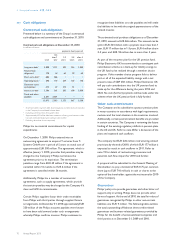
5.2.3 Financing
Condensed consolidated balance sheets for the years
2008, 2009 and 2010 are presented below:
Condensed consolidated balance sheet information1)
in millions of euros
2008 2009 2010
Intangible assets 11,757 11,523 12,233
Property, plant and equipment 3,496 3,252 3,265
Inventories 3,491 2,913 3,865
Receivables 7,548 7,188 6,296
Accounts payable and other liabilities (9,292) (9,166) (10,180)
Provisions (2,837) (2,450) (2,339)
Other financial assets 1,705 984 596
Investments in associates 293 281 181
16,161 14,525 13,917
Cash and cash equivalents 3,620 4,386 5,833
Debt (4,188) (4,267) (4,658)
Net cash (debt) (568) 119 1,175
Non-controlling interests (49) (49) (46)
Shareholders’ equity (15,544) (14,595) (15,046)
(16,161) (14,525) (13,917)
1) Please refer to section 13.6, Consolidated balance sheets, of this Annual Report
5.2.4 Cash and cash equivalents
In 2010, cash and cash equivalents increased by EUR 1,447
million to EUR 5,833 million at year-end. Cash inflow from
operations amounted to EUR 2,156 million, a total
outflow on net capital expenditure of EUR 823 million,
and there was EUR 385 million proceeds from
divestments including EUR 268 million from the sale of
stakes. This was partly offset by an outflow of
EUR 296 million related to the cash dividend payout,
EUR 239 million for acquisitions and favorable currency
translation effects of EUR 89 million.
In 2009, cash and cash equivalents increased by EUR 766
million to EUR 4,386 million at year-end. Cash inflow from
operations amounted to EUR 1,545 million, and there was
EUR 802 million proceeds from divestments including
EUR 718 million from the sale of stakes. This was partly
offset by an outflow of EUR 647 million related to the
annual dividend, EUR 300 million for acquisitions and small
unfavorable currency translation effects of EUR 15 million.