Philips 2010 Annual Report Download - page 229
Download and view the complete annual report
Please find page 229 of the 2010 Philips annual report below. You can navigate through the pages in the report by either clicking on the pages listed below, or by using the keyword search tool below to find specific information within the annual report.-
 1
1 -
2
-
3
-
4
-
5
-
6
-
7
-
8
-
9
-
10
-
11
-
12
-
13
-
14
-
15
-
16
-
17
-
18
-
19
-
20
-
21
-
22
-
23
-
24
-
25
-
26
-
27
-
28
-
29
-
30
-
31
-
32
-
33
-
34
-
35
-
36
-
37
-
38
-
39
-
40
-
41
-
42
-
43
-
44
-
45
-
46
-
47
-
48
-
49
-
50
-
51
-
52
-
53
-
54
-
55
-
56
-
57
-
58
-
59
-
60
-
61
-
62
-
63
-
64
-
65
-
66
-
67
-
68
-
69
-
70
-
71
-
72
-
73
-
74
-
75
-
76
-
77
-
78
-
79
-
80
-
81
-
82
-
83
-
84
-
85
-
86
-
87
-
88
-
89
-
90
-
91
-
92
-
93
-
94
-
95
-
96
-
97
-
98
-
99
-
100
-
101
-
102
-
103
-
104
-
105
-
106
-
107
-
108
-
109
-
110
-
111
-
112
-
113
-
114
-
115
-
116
-
117
-
118
-
119
-
120
-
121
-
122
-
123
-
124
-
125
-
126
-
127
-
128
-
129
-
130
-
131
-
132
-
133
-
134
-
135
-
136
-
137
-
138
-
139
-
140
-
141
-
142
-
143
-
144
-
145
-
146
-
147
-
148
-
149
-
150
-
151
-
152
-
153
-
154
-
155
-
156
-
157
-
158
-
159
-
160
-
161
-
162
-
163
-
164
-
165
-
166
-
167
-
168
-
169
-
170
-
171
-
172
-
173
-
174
-
175
-
176
-
177
-
178
-
179
-
180
-
181
-
182
-
183
-
184
-
185
-
186
-
187
-
188
-
189
-
190
-
191
-
192
-
193
-
194
-
195
-
196
-
197
-
198
-
199
-
200
-
201
-
202
-
203
-
204
-
205
-
206
-
207
-
208
-
209
-
210
-
211
-
212
-
213
-
214
-
215
-
216
-
217
-
218
-
 219
219 -
 220
220 -
 221
221 -
 222
222 -
 223
223 -
 224
224 -
 225
225 -
 226
226 -
 227
227 -
 228
228 -
 229
229 -
 230
230 -
 231
231 -
 232
232 -
 233
233 -
 234
234 -
 235
235 -
 236
236 -
 237
237 -
 238
238 -
 239
239 -
240
-
241
-
242
-
243
-
244
-
245
-
246
-
247
-
248
-
249
-
250
 |
 |
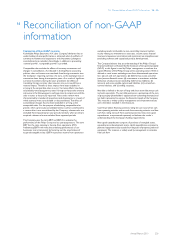
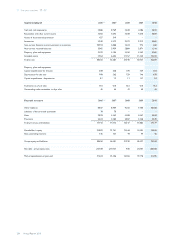
16 Reconciliation of non-GAAP information 16 - 16
Annual Report 2010 229
16 Reconciliation of non-GAAP
information
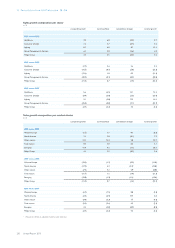
Explanation of Non-GAAP measures
Koninklijke Philips Electronics N.V. (the ‘Company’) believes that an
understanding of sales performance is enhanced when the effects of
currency movements and acquisitions and divestments (changes in
consolidation) are excluded. Accordingly, in addition to presenting
‘nominal growth’, ‘comparable growth’ is provided.
Comparable sales exclude the effects of currency movements and
changes in consolidation. As indicated in the Significant accounting
policies, sales and income are translated from foreign currencies into
the Company’s reporting currency, the euro, at the exchange rate on
transaction dates during the respective years. As a result of significant
currency movements during the years presented, the effects of
translating foreign currency sales amounts into euros could have a
material impact. Therefore, these impacts have been excluded in
arriving at the comparable sales in euros. Currency effects have been
calculated by translating previous years’ foreign currency sales amounts
into euros at the following year’s exchange rates in comparison with the
sales in euros as historically reported. Years under review were
characterized by a number of acquisitions and divestments, as a result of
which activities were consolidated or deconsolidated. The effect of
consolidation changes has also been excluded in arriving at the
comparable sales. For the purpose of calculating comparable sales
growth, when a previously consolidated entity is sold or contributed to
a venture that is not consolidated by the Company, relevant sales are
excluded from impacted prior-year periods. Similarly, when an entity is
acquired, relevant sales are excluded from impacted periods.
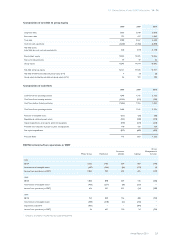
The Company uses the term EBIT and EBITA to evaluate the
performance of the Philips Group and its operating sectors. The term
EBIT has the same meaning as Income from operations (IFO).
Referencing EBITA will make the underlying performance of our
businesses more transparent by factoring out the amortization of
acquired intangible assets. EBITA represents income from operations
excluding results attributable to non-controlling interests holders,
results relating to investments in associates, income taxes, financial
income and expenses, amortization and impairment on intangible assets
(excluding software and capitalized product development).
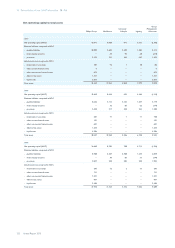
The Company believes that an understanding of the Philips Group’s
financial condition is enhanced by the disclosure of net operating capital
(NOC), as this figure is used by Philips’ management to evaluate the
capital efficiency of the Philips Group and its operating sectors. NOC is
defined as: total assets excluding assets from discontinued operations
less: (a) cash and cash equivalents, (b) deferred tax assets, (c) other
(non-)current financial assets, (d) investments in associates, and after
deduction of: (e) provisions excluding deferred tax liabilities, (f)
accounts and notes payable, (g) accrued liabilities, (h) current/non-
current liabilities, and (i) trading securities.
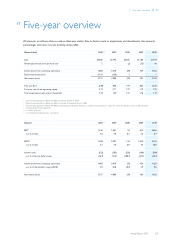
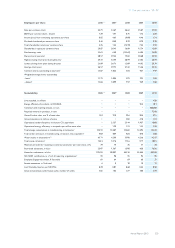
Net debt is defined as the sum of long- and short-term debt minus cash
and cash equivalents. The net debt position as a percentage of the sum
of group equity (shareholders’ equity and non-controlling interests) and
net debt is presented to express the financial strength of the Company.
This measure is widely used by management and investment analysts
and is therefore included in the disclosure.
Cash flows before financing activities, being the sum total of net cash
from operating activities and net cash from investing activities, and free
cash flow, being net cash from operating activities minus net capital
expenditures, are presented separately to facilitate the reader’s
understanding of the Company’s funding requirements.
Net capital expenditures comprise of purchase of intangible assets,
expenditures on development assets, capital expenditures on property,
plant and equipment and proceeds from disposals of property, plant and
equipment. This measure is widely used by management to calculate
free cash flow.