Philips 2010 Annual Report Download - page 211
Download and view the complete annual report
Please find page 211 of the 2010 Philips annual report below. You can navigate through the pages in the report by either clicking on the pages listed below, or by using the keyword search tool below to find specific information within the annual report.-
 1
1 -
2
-
3
-
4
-
5
-
6
-
7
-
8
-
9
-
10
-
11
-
12
-
13
-
14
-
15
-
16
-
17
-
18
-
19
-
20
-
21
-
22
-
23
-
24
-
25
-
26
-
27
-
28
-
29
-
30
-
31
-
32
-
33
-
34
-
35
-
36
-
37
-
38
-
39
-
40
-
41
-
42
-
43
-
44
-
45
-
46
-
47
-
48
-
49
-
50
-
51
-
52
-
53
-
54
-
55
-
56
-
57
-
58
-
59
-
60
-
61
-
62
-
63
-
64
-
65
-
66
-
67
-
68
-
69
-
70
-
71
-
72
-
73
-
74
-
75
-
76
-
77
-
78
-
79
-
80
-
81
-
82
-
83
-
84
-
85
-
86
-
87
-
88
-
89
-
90
-
91
-
92
-
93
-
94
-
95
-
96
-
97
-
98
-
99
-
100
-
101
-
102
-
103
-
104
-
105
-
106
-
107
-
108
-
109
-
110
-
111
-
112
-
113
-
114
-
115
-
116
-
117
-
118
-
119
-
120
-
121
-
122
-
123
-
124
-
125
-
126
-
127
-
128
-
129
-
130
-
131
-
132
-
133
-
134
-
135
-
136
-
137
-
138
-
139
-
140
-
141
-
142
-
143
-
144
-
145
-
146
-
147
-
148
-
149
-
150
-
151
-
152
-
153
-
154
-
155
-
156
-
157
-
158
-
159
-
160
-
161
-
162
-
163
-
164
-
165
-
166
-
167
-
168
-
169
-
170
-
171
-
172
-
173
-
174
-
175
-
176
-
177
-
178
-
179
-
180
-
181
-
182
-
183
-
184
-
185
-
186
-
187
-
188
-
189
-
190
-
191
-
192
-
193
-
194
-
195
-
196
-
197
-
198
-
199
-
200
-
 201
201 -
 202
202 -
 203
203 -
 204
204 -
 205
205 -
 206
206 -
 207
207 -
 208
208 -
 209
209 -
 210
210 -
 211
211 -
 212
212 -
 213
213 -
 214
214 -
 215
215 -
 216
216 -
 217
217 -
 218
218 -
 219
219 -
 220
220 -
 221
221 -
222
-
223
-
224
-
225
-
226
-
227
-
228
-
229
-
230
-
231
-
232
-
233
-
234
-
235
-
236
-
237
-
238
-
239
-
240
-
241
-
242
-
243
-
244
-
245
-
246
-
247
-
248
-
249
-
250
 |
 |

15 Sustainability statements 15.2 - 15.3
Annual Report 2010 211
Energy Efficiency of Philips products
In order to calculate the energy efficiency of our products, we include in
our methodology the energy-consuming product categories of all three
sectors. The annual energy consumption per product category is
calculated by multiplying the power consumption of a product with the
average annual operating hours and the annual pieces sold and then
dividing the outcome by the annual sales. The average energy efficiency
of our total product portfolio improved by 4% in 2010. Further details
on this parameter and the methodology can be found in the document
‘Energy efficiency of Philips products’.
Closing the materials loop
In 2010 we determined the 2009 baseline for global collection and
recycling amounts at around 100,000 tons, based on the data retrieved
from the WEEE collection schemes and from our own recycling and
refurbishment services (mainly Healthcare). Further details on this
parameter and the methodology can be found in the document
‘Collection and recycling’.
We also determined the 2009 baseline for recycled materials in our
products at 7,500 tons, by focusing on the material streams such as
plastics, certain metals and refurbished products, depending on the
relevance in each sector. Further details on this parameter and the
methodology can be found in the document ‘Recycled materials’.
More information on EcoVision5 can be found at www.philips.com/
sustainability.
15.3 EcoVision4
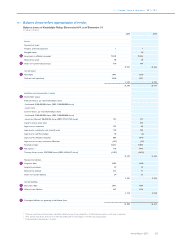
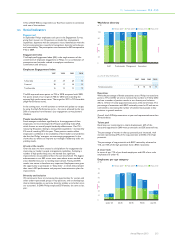
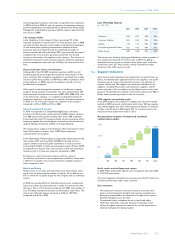
Green Product sales
Sales from Green Products grew in 2010 to EUR 9.5 billion, contributing
significantly to the total revenue stream. As a percentage of the
company total sales, Green Product sales increased to 37.5%, up from
30.6 % in 2009. We are well on track to achieve our target of 50% in
2015.
Green Product sales
in billions of euros unless otherwise stated
2008 2009 2010
Philips Group 6.0 7.1 9.5
as a % of total sales 23 31 38
All sectors contributed to the growth in Green Product sales.
Consumer Lifestyle achieved the highest Green Product nominal sales
growth (58%), followed by Lighting (29%) and Healthcare (20%).
Lighting introduced over 1,300 new Green Products in 2010,
Consumer Lifestyle 150 and Healthcare five. Major acquisitions, like
Respironics, Consumer Luminaires and Genlyte, are included.
Green Product sales per sector
as a % of Group sales
2008 2009 2010
Healthcare 20 23 25
Consumer Lifestyle 14 23 34
Lighting 40 52 58
Philips Group 23 31 38
The Philips EcoDesign process aims to create products that have
significantly less impact on the environment during their whole lifecycle.
Overall, improvements are predominantly realized in our energy
efficiency Green Focal Area.
New Green Products from each sector include the following examples.
Healthcare
The new Intellibridge EC40/80 is a system that is used for acquiring,
transforming, mapping, and the subsequent routing of data from
electronic bedside patient-care devices to the Philips IntelliVue Clinical
Information Portfolio, a remote clinical information system. The
Intellibridge EC40/80 can serve more patient beds than its predecessor,
and therefore more patient data is sent to the central monitoring
systems from one device. This is accomplished in a smaller, lighter and
more user-friendly device. Compared to its predecessor, the
Intellibridge monitor’s environmental benefits include a 67% reduction
in energy use, 13% less product weight and 5% less packaging weight,
resulting in an improvement of the environmental impact of the total life
cycle of 53%.
The new Essential is a Patient Monitor designed specifically for
improved clinical workflow and patient safety during transport of a
sedated patient in the MRI department. Its technical and environmental
performance as a stand-alone MRI Pulse Oximeter hasimproved
compared to its predecessor. The environmental benefits are a 48%
reduction in energy use, 72% less product weight, 32% less packaging
weight and being lead-acid battery free, resulting in an improvement of
the environmental impact of the total life cycle of 55%.
Consumer Lifestyle
Energy management has always been a strong focus in the Consumer
Lifestyle sector but also the avoidance of substances of concern in our
products, in addition to our efforts to close the materials loop. In 2010
our energy reduction efforts paid back in the consumer TV business by
achieving green labels in our complete EU-product portfolio according
to the EU-energy label. This will become mandatory by the end of 2011.
In 2010, Philips also started with the introduction of polyvinyl chloride
(PVC) and brominated flame retardants (BFR) free products. In relation
to these developments, Philips has launched the Econova TV, which is
the first PVC/BFR free TV in the world, and uses LED technology
allowing very low energy consumption, achieving “A+” EU-energy label
too. Additionally, this TV has won the EISA Best Green TV 2010/2011
award.
Lighting
In the 3rd quarter of 2010, Philips globally launched the industry’s first
LED replacement lamp for the ubiquitous 60W GLS bulb, meeting all
requirements as defined by IEC (Eu244), CE, UL, FCC, and the USA’s
Energy Star. Commercially launched in the USA as the 12W EnduraLED
A19, it has been recognized by the American Lighting Association as the
winner in the LED Replacement Lamps category of the Lighting for
Tomorrow Awards. It has received further accolades from the media,
like the “Green Product of the Year 2010” award from Popular Science
Magazine. With this product, Philips continues to set the pace in the
LED Replacement Lamps market, and has made the lamps available
across the globe. Official Energy Star certification was achieved on
January 28, 2011.
India is a fast growing market and to underline Philips’ commitment to
the needs of Indian end users, Philips developed and produced a new
5W LED Lamp in India. Philips launched this 5W LED Lamp in October,
in selected stores in all major cities. The India LED Lamp has been
developed in close cooperation between the Philips R&D centers in
Noida, India, and Shanghai, China, to meet the India specific
requirements. These local requirements not only demanded special
requirements on the performance of the product, but in effect a full
localization of the manufacturing. In order to leverage local customer
insights, we empower local teams in key markets to drive the
development of new products to be launched.
Green Innovations
In 2010 Philips invested more than EUR 450 million in Green
Innovations – the R&D spend related to the development of new
generations of Green Products and Green Technologies. We strive to
invest a cumulative EUR 2 billion during the coming five years.
Green Innovations per sector
in millions of euros
2008 2009 2010
Healthcare 54 50 60
Consumer Lifestyle 36 131 115
Lighting 151 185 230
Corporate Technologies 41 44 46
Philips Group 282 410 451
Healthcare
Philips Healthcare invested some EUR 60 million, concentrating on
innovation projects that consider all of the Green Focal Areas and aim
to reduce total life cycle impact. In particular the sector focuses on
reducing energy consumption, weight and radiation dose.