Philips 2010 Annual Report Download - page 76
Download and view the complete annual report
Please find page 76 of the 2010 Philips annual report below. You can navigate through the pages in the report by either clicking on the pages listed below, or by using the keyword search tool below to find specific information within the annual report.-
 1
1 -
2
-
3
-
4
-
5
-
6
-
7
-
8
-
9
-
10
-
11
-
12
-
13
-
14
-
15
-
16
-
17
-
18
-
19
-
20
-
21
-
22
-
23
-
24
-
25
-
26
-
27
-
28
-
29
-
30
-
31
-
32
-
33
-
34
-
35
-
36
-
37
-
38
-
39
-
40
-
41
-
42
-
43
-
44
-
45
-
46
-
47
-
48
-
49
-
50
-
51
-
52
-
53
-
54
-
55
-
56
-
57
-
58
-
59
-
60
-
61
-
62
-
63
-
64
-
65
-
 66
66 -
 67
67 -
 68
68 -
 69
69 -
 70
70 -
 71
71 -
 72
72 -
 73
73 -
 74
74 -
 75
75 -
 76
76 -
 77
77 -
 78
78 -
 79
79 -
 80
80 -
 81
81 -
 82
82 -
 83
83 -
 84
84 -
 85
85 -
 86
86 -
87
-
88
-
89
-
90
-
91
-
92
-
93
-
94
-
95
-
96
-
97
-
98
-
99
-
100
-
101
-
102
-
103
-
104
-
105
-
106
-
107
-
108
-
109
-
110
-
111
-
112
-
113
-
114
-
115
-
116
-
117
-
118
-
119
-
120
-
121
-
122
-
123
-
124
-
125
-
126
-
127
-
128
-
129
-
130
-
131
-
132
-
133
-
134
-
135
-
136
-
137
-
138
-
139
-
140
-
141
-
142
-
143
-
144
-
145
-
146
-
147
-
148
-
149
-
150
-
151
-
152
-
153
-
154
-
155
-
156
-
157
-
158
-
159
-
160
-
161
-
162
-
163
-
164
-
165
-
166
-
167
-
168
-
169
-
170
-
171
-
172
-
173
-
174
-
175
-
176
-
177
-
178
-
179
-
180
-
181
-
182
-
183
-
184
-
185
-
186
-
187
-
188
-
189
-
190
-
191
-
192
-
193
-
194
-
195
-
196
-
197
-
198
-
199
-
200
-
201
-
202
-
203
-
204
-
205
-
206
-
207
-
208
-
209
-
210
-
211
-
212
-
213
-
214
-
215
-
216
-
217
-
218
-
219
-
220
-
221
-
222
-
223
-
224
-
225
-
226
-
227
-
228
-
229
-
230
-
231
-
232
-
233
-
234
-
235
-
236
-
237
-
238
-
239
-
240
-
241
-
242
-
243
-
244
-
245
-
246
-
247
-
248
-
249
-
250
 |
 |

5 Group performance 5.4.2 - 5.4.4
76 Annual Report 2010
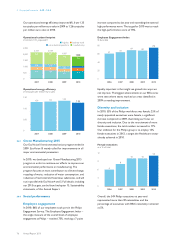
Our operational energy efficiency improved 6%, from 1.35
terajoules per million euro sales in 2009 to 1.26 terajoules
per million euro sales in 2010.
Operational carbon footprint
in kilotons CO2-equivalent ■-logistics--■-business travel
■-non-industrial operations--■-manufacturing
2,500
2,000
1,500
1,000
500
0
2007
715
276
218
948
2,157
2008
704
265
216
959
2,144
2009
614
220
193
910
1,937
2010
664
247 143
754
1,808
Operational energy efficiency
in terajoules per million euro sales
1.50
1.00
0.50
0
1.29
2007
1.31
2008
1.35
2009
1.26
2010
5.4.3 Green Manufacturing 2015
Our EcoVision III environmental action program ended in
2009. EcoVision III mainly called for improvements in all
major environmental parameters.
In 2010, we developed our Green Manufacturing 2015
program in order to continue our efforts to improve our
environmental performance in manufacturing. The
program focuses on most contributors to climate change,
recycling of waste, reduction of water consumption, and
reduction of restricted and hazardous substances, and will
run in parallel with EcoVision4 and 5. Full details, including
our 2015 targets, can be found inchapter 15, Sustainability
statements, of this Annual Report.
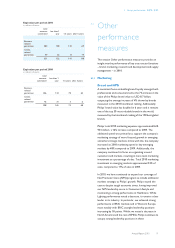
5.4.4 Social performance
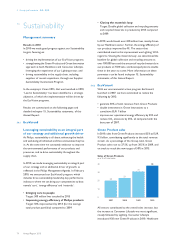
Employee engagement
In 2010, 86% of our employees took part in the Philips
Engagement Survey. The Employee Engagement Index –
the single measure of the overall level of employee
engagement at Philips – reached 75%, marking a 7 point
increase compared to last year and exceeding the external
high performance norm. The target for 2010 was to reach
the high-performance score of 70%.
Employee Engagement Index
% favorable
80
60
40
20
0
61
2006
64
2007
69
2008
68
2009
75
2010
Equally important is the insight we gained into ways we
can improve. The biggest advancements in our EES scores
were seen where teams worked on areas identified in
2009 as needing improvement.
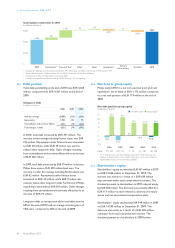
Diversity and inclusion
In 2010, 35% of the Philips workforce was female; 25% of
newly appointed executives were female, a significant
increase compared to 2009, illustrating our focus on
diversity and inclusion. Due to the recruitment of more
female executives, the total number increased to 11%.
Our ambition for the Philips group is to employ 15%
female executives in 2012, a target the Healthcare sector
already achieved in 2010.
Female executives
as a % of total
12
9
6
3
0
6
2006
8
2007
10
2008
10
2009
11
2010
Overall, the 549 Philips executives at year-end
represented more than 30 nationalities and the
percentage of executives with BRIC nationality remained
at 5%.