Philips 2010 Annual Report Download - page 71
Download and view the complete annual report
Please find page 71 of the 2010 Philips annual report below. You can navigate through the pages in the report by either clicking on the pages listed below, or by using the keyword search tool below to find specific information within the annual report.-
 1
1 -
2
-
3
-
4
-
5
-
6
-
7
-
8
-
9
-
10
-
11
-
12
-
13
-
14
-
15
-
16
-
17
-
18
-
19
-
20
-
21
-
22
-
23
-
24
-
25
-
26
-
27
-
28
-
29
-
30
-
31
-
32
-
33
-
34
-
35
-
36
-
37
-
38
-
39
-
40
-
41
-
42
-
43
-
44
-
45
-
46
-
47
-
48
-
49
-
50
-
51
-
52
-
53
-
54
-
55
-
56
-
57
-
58
-
59
-
60
-
 61
61 -
 62
62 -
 63
63 -
 64
64 -
 65
65 -
 66
66 -
 67
67 -
 68
68 -
 69
69 -
 70
70 -
 71
71 -
 72
72 -
 73
73 -
 74
74 -
 75
75 -
 76
76 -
 77
77 -
 78
78 -
 79
79 -
 80
80 -
 81
81 -
82
-
83
-
84
-
85
-
86
-
87
-
88
-
89
-
90
-
91
-
92
-
93
-
94
-
95
-
96
-
97
-
98
-
99
-
100
-
101
-
102
-
103
-
104
-
105
-
106
-
107
-
108
-
109
-
110
-
111
-
112
-
113
-
114
-
115
-
116
-
117
-
118
-
119
-
120
-
121
-
122
-
123
-
124
-
125
-
126
-
127
-
128
-
129
-
130
-
131
-
132
-
133
-
134
-
135
-
136
-
137
-
138
-
139
-
140
-
141
-
142
-
143
-
144
-
145
-
146
-
147
-
148
-
149
-
150
-
151
-
152
-
153
-
154
-
155
-
156
-
157
-
158
-
159
-
160
-
161
-
162
-
163
-
164
-
165
-
166
-
167
-
168
-
169
-
170
-
171
-
172
-
173
-
174
-
175
-
176
-
177
-
178
-
179
-
180
-
181
-
182
-
183
-
184
-
185
-
186
-
187
-
188
-
189
-
190
-
191
-
192
-
193
-
194
-
195
-
196
-
197
-
198
-
199
-
200
-
201
-
202
-
203
-
204
-
205
-
206
-
207
-
208
-
209
-
210
-
211
-
212
-
213
-
214
-
215
-
216
-
217
-
218
-
219
-
220
-
221
-
222
-
223
-
224
-
225
-
226
-
227
-
228
-
229
-
230
-
231
-
232
-
233
-
234
-
235
-
236
-
237
-
238
-
239
-
240
-
241
-
242
-
243
-
244
-
245
-
246
-
247
-
248
-
249
-
250
 |
 |

5 Group performance 5.2.9 - 5.3.1
Annual Report 2010 71
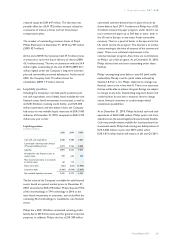
Expiration per period 2010
in millions of euros
total
amounts
committed less than 1
year 1-5 years after 5 years
Business-
related
guarantees 302 100 133 69
Credit-
related
guarantees 49 22 8 19
351 122 141 88
Expiration per period 2009
in millions of euros
total
amounts
committed less than 1
year 1-5 years after 5 years
Business-
related
guarantees 266 134 70 62
Credit-
related
guarantees 42 31 5 6
308 165 75 68
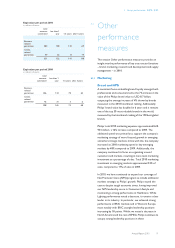
5.3 Other
performance
measures
The section Other performance measures provides an
insight into the performance of key cross-sector functions
– brand, marketing, research and development and supply
management – in 2010.
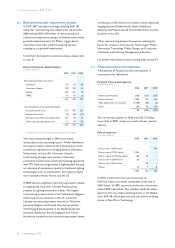
5.3.1 Marketing
Brand and NPS
A consistent focus on building brand loyalty amongst both
professionals and consumers led to the 7% increase in the
value of the Philips brand value to USD 8.7 billion,
outpacing the average increase of 4% shown by brands
measured in the 2010 Interbrand ranking. Additionally,
Philips’ brand value has doubled in 6 years and it remains
one of the top 50 most valuable brands in the world,
measured by the Interbrand ranking of the 100 best global
brands.
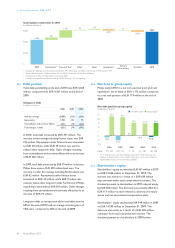
Philips’ total 2010 marketing expenses approximated EUR
934 million, a 16% increase compared to 2009. The
additional spend was primarily to support the company’s
marketing strategy of more focused growth in emerging
and other strategic markets. In line with this, the company
increased its 2010 marketing spend in key emerging
markets by 48% compared to 2009. Additionally, the
company continued its focus on organizing around
customers and markets, resulting in more local marketing
investment as a percentage of sales. Total 2010 marketing
investment in emerging markets approximated 22% of
sales, compared to 17% of sales in 2009.
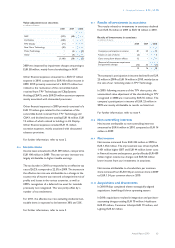
In 2010, we have continued to expand our coverage of
Net Promoter Score (NPS) program to include additional
markets strategic to Philips’ growth. Philips stayed the
course despite tough economic times, having improved
our NPS leadership score in Consumer Lifestyle and
maintaining a strong performance in Healthcare. While
Lighting performance noted a decrease, it remains a clear
leader in its industry. In particular, we achieved strong
performance in BRIC markets and in Western Europe,
most notably with BRIC outright leadership positions
increasing by 18 points. Whilst we noted a decrease in
North America and the rest of EMEA, Philips continues to
occupy strong leadership positions in these