Philips 2010 Annual Report Download - page 185
Download and view the complete annual report
Please find page 185 of the 2010 Philips annual report below. You can navigate through the pages in the report by either clicking on the pages listed below, or by using the keyword search tool below to find specific information within the annual report.-
 1
1 -
2
-
3
-
4
-
5
-
6
-
7
-
8
-
9
-
10
-
11
-
12
-
13
-
14
-
15
-
16
-
17
-
18
-
19
-
20
-
21
-
22
-
23
-
24
-
25
-
26
-
27
-
28
-
29
-
30
-
31
-
32
-
33
-
34
-
35
-
36
-
37
-
38
-
39
-
40
-
41
-
42
-
43
-
44
-
45
-
46
-
47
-
48
-
49
-
50
-
51
-
52
-
53
-
54
-
55
-
56
-
57
-
58
-
59
-
60
-
61
-
62
-
63
-
64
-
65
-
66
-
67
-
68
-
69
-
70
-
71
-
72
-
73
-
74
-
75
-
76
-
77
-
78
-
79
-
80
-
81
-
82
-
83
-
84
-
85
-
86
-
87
-
88
-
89
-
90
-
91
-
92
-
93
-
94
-
95
-
96
-
97
-
98
-
99
-
100
-
101
-
102
-
103
-
104
-
105
-
106
-
107
-
108
-
109
-
110
-
111
-
112
-
113
-
114
-
115
-
116
-
117
-
118
-
119
-
120
-
121
-
122
-
123
-
124
-
125
-
126
-
127
-
128
-
129
-
130
-
131
-
132
-
133
-
134
-
135
-
136
-
137
-
138
-
139
-
140
-
141
-
142
-
143
-
144
-
145
-
146
-
147
-
148
-
149
-
150
-
151
-
152
-
153
-
154
-
155
-
156
-
157
-
158
-
159
-
160
-
161
-
162
-
163
-
164
-
165
-
166
-
167
-
168
-
169
-
170
-
171
-
172
-
173
-
174
-
 175
175 -
 176
176 -
 177
177 -
 178
178 -
 179
179 -
 180
180 -
 181
181 -
 182
182 -
 183
183 -
 184
184 -
 185
185 -
 186
186 -
 187
187 -
 188
188 -
 189
189 -
 190
190 -
 191
191 -
 192
192 -
 193
193 -
 194
194 -
 195
195 -
196
-
197
-
198
-
199
-
200
-
201
-
202
-
203
-
204
-
205
-
206
-
207
-
208
-
209
-
210
-
211
-
212
-
213
-
214
-
215
-
216
-
217
-
218
-
219
-
220
-
221
-
222
-
223
-
224
-
225
-
226
-
227
-
228
-
229
-
230
-
231
-
232
-
233
-
234
-
235
-
236
-
237
-
238
-
239
-
240
-
241
-
242
-
243
-
244
-
245
-
246
-
247
-
248
-
249
-
250
 |
 |

13 Group financial statements 13.11 - 13.11
Annual Report 2010 185
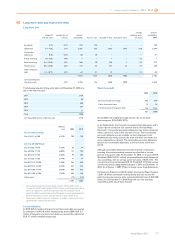
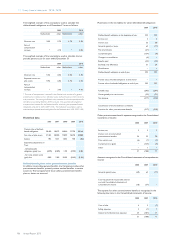
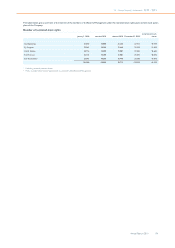
Plan assets in other countries
The Company’s pension plan asset allocation in other countries at
December 31, is shown in the table below. This table also shows the
target allocation for 2011:
2009 2010 2011
actual actual target
% % %
Equity securities 19 23 22
Debt securities 76 70 77
Real estate 3 1 1
Other 2 6 −
100 100 100
Plan assets in 2010 do not include property occupied nor financial
instruments held by the Philips Group.
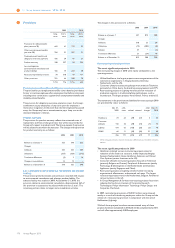
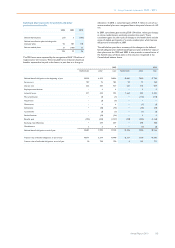
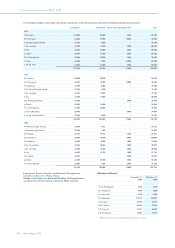
Pension expense of defined-benefit plans recognized in the Consolidated statements of income:
2008 2009 2010
Netherlands other total Netherlands other total Netherlands other total
Service cost 135 84 219 107 75 182 92 77 169
Interest cost on the
defined-benefit obligation 524 398 922 532 395 927 521 418 939
Expected return on plan assets (769) (392) (1,161) (758) (343) (1,101) (743) (344) (1,087)
Prior-service cost − 2 2 − (3) (3) − (119) (119)
Settlement loss (gain) − − − − − − − (6) (6)
Curtailment loss (gain) − − − − (5) (5) − (1) (1)
Other (3) − (3) 2 1 3 1 1 2
(113) 92 (21) (117) 120 3 (129) 26 (103)
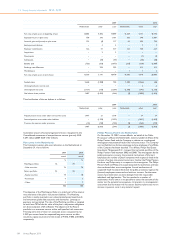
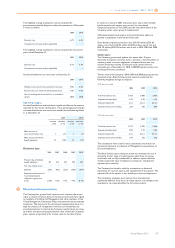
Amounts recognized in the Consolidated statements of comprehensive
income:
2008 2009 2010
Actuarial losses 773 678 1,535
Change in the effect of the cap on prepaids 772 369 427
Total recognized in Consolidated
statements of comprehensive income 1,545 1,047 1,962
Total recognized in net periodic pension
cost and Consolidated statements of
comprehensive income 1,524 1,050 1,859
Actual return on plan assets (794) 1,218 1,807
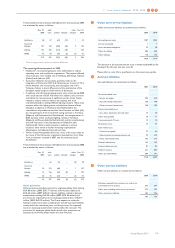
The pension expense of defined-benefit plans is recognized in the
following line items in the Consolidated statements of income:
2008 2009 2010
Cost of sales (23) 7 7
Selling expenses 24 13 12
General and administrative expenses (23) (14) (120)
Research and development expenses 1 (3) (2)
(21) 3 (103)
The Company also sponsors defined-contribution and similar types of
plans for a significant number of salaried employees. The total cost of
these plans amounted to EUR 118 million (2009: EUR 107 million, 2008:
EUR 96 million). In 2010, the defined-contribution cost includes
contributions to multi-employer plans of EUR 6 million (2009: EUR 5
million; 2008: EUR 4 million).
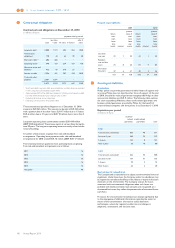
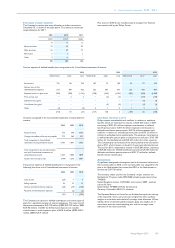
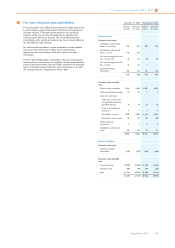
Cash flows and costs in 2011
Philips expects considerable cash outflows in relation to employee
benefits which are estimated to amount to EUR 627 million in 2011,
consisting of EUR 421 million employer contributions to defined-
benefit pension plans, EUR 125 million employer contributions to
defined-contribution pension plans, EUR 56 million expected cash
outflows in relation to unfunded pension plans and EUR 25 million in
relation to unfunded retiree medical plans. The employer contributions
to defined-benefit pension plans are expected to amount to EUR 186
million for the Netherlands and EUR 235 million for other countries.
The Company plans to fund part of the existing deficit in the US pension
plan in 2011, which amount is included in the amounts aforementioned.
The cost for 2011 is expected to amount to EUR 208 million, consisting
of EUR 66 million for defined-benefit pension plans, EUR 125 million for
defined-contribution pension plans and EUR 17 million for defined-
benefit retiree medical plans.
Assumptions
A significant demographic assumption used in the actuarial valuations is
the mortality table. In 2010, a new mortality table was adopted for the
plan in the Netherlands that caused the DBO in the Netherlands to
increase by EUR 750 million.
The mortality tables used for the Company’s major schemes are:
Netherlands: Prognosis table 2010-2060 including experience rating
TW2010
United Kingdom retirees: SAPS 2002- short cohort 2009 - medium
cohort 1% floor
United States: RP2000 CH Fully Generational
Germany: Richttafeln 2005 G.K. Heubeck
The Expected Return on Assets for any funded plan equals the average
of the expected returns per asset class weighted by their portfolio
weights in accordance with the fund’s strategic asset allocation. Where
liability-driven investment (LDI) strategies apply, the weights are in
accordance with the actual matching part and the strategic asset
allocation of the return portfolio.