Philips 2010 Annual Report Download - page 204
Download and view the complete annual report
Please find page 204 of the 2010 Philips annual report below. You can navigate through the pages in the report by either clicking on the pages listed below, or by using the keyword search tool below to find specific information within the annual report.-
 1
1 -
2
-
3
-
4
-
5
-
6
-
7
-
8
-
9
-
10
-
11
-
12
-
13
-
14
-
15
-
16
-
17
-
18
-
19
-
20
-
21
-
22
-
23
-
24
-
25
-
26
-
27
-
28
-
29
-
30
-
31
-
32
-
33
-
34
-
35
-
36
-
37
-
38
-
39
-
40
-
41
-
42
-
43
-
44
-
45
-
46
-
47
-
48
-
49
-
50
-
51
-
52
-
53
-
54
-
55
-
56
-
57
-
58
-
59
-
60
-
61
-
62
-
63
-
64
-
65
-
66
-
67
-
68
-
69
-
70
-
71
-
72
-
73
-
74
-
75
-
76
-
77
-
78
-
79
-
80
-
81
-
82
-
83
-
84
-
85
-
86
-
87
-
88
-
89
-
90
-
91
-
92
-
93
-
94
-
95
-
96
-
97
-
98
-
99
-
100
-
101
-
102
-
103
-
104
-
105
-
106
-
107
-
108
-
109
-
110
-
111
-
112
-
113
-
114
-
115
-
116
-
117
-
118
-
119
-
120
-
121
-
122
-
123
-
124
-
125
-
126
-
127
-
128
-
129
-
130
-
131
-
132
-
133
-
134
-
135
-
136
-
137
-
138
-
139
-
140
-
141
-
142
-
143
-
144
-
145
-
146
-
147
-
148
-
149
-
150
-
151
-
152
-
153
-
154
-
155
-
156
-
157
-
158
-
159
-
160
-
161
-
162
-
163
-
164
-
165
-
166
-
167
-
168
-
169
-
170
-
171
-
172
-
173
-
174
-
175
-
176
-
177
-
178
-
179
-
180
-
181
-
182
-
183
-
184
-
185
-
186
-
187
-
188
-
189
-
190
-
191
-
192
-
193
-
 194
194 -
 195
195 -
 196
196 -
 197
197 -
 198
198 -
 199
199 -
 200
200 -
 201
201 -
 202
202 -
 203
203 -
 204
204 -
 205
205 -
 206
206 -
 207
207 -
 208
208 -
 209
209 -
 210
210 -
 211
211 -
 212
212 -
 213
213 -
 214
214 -
215
-
216
-
217
-
218
-
219
-
220
-
221
-
222
-
223
-
224
-
225
-
226
-
227
-
228
-
229
-
230
-
231
-
232
-
233
-
234
-
235
-
236
-
237
-
238
-
239
-
240
-
241
-
242
-
243
-
244
-
245
-
246
-
247
-
248
-
249
-
250
 |
 |

14 Company financial statements 14.4 - 14.4
204 Annual Report 2010
Preference shares
The ‘Stichting Preferente Aandelen Philips’ has been granted the right to
acquire preference shares in the Company. Such right has not been
exercised. As a means to protect the Company and its stakeholders
against an unsolicited attempt to (de facto) take over control of the
Company, the General Meeting of Shareholders in 1989 adopted
amendments to the Company’s articles of association that allow the
Board of Management and the Supervisory Board to issue (rights to
acquire) preference shares to a third party. As of December 31, 2010,
no preference shares have been issued.
Option rights/restricted shares
The Company has granted stock options on its common shares and
rights to receive common shares in the future. Please refer to note 29,
which is deemed incorporated and repeated herein by reference.
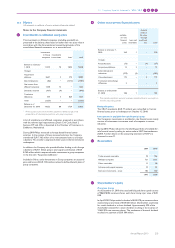
Treasury shares
In connection with the Company’s share repurchase programs, shares
which have been repurchased and are held in treasury for (i) delivery
upon exercise of options and convertible personnel debentures and
under restricted share programs and employee share purchase
programs, and (ii) capital reduction purposes, are accounted for as a
reduction of shareholders’ equity. Treasury shares are recorded at
cost, representing the market price on the acquisition date. When
issued, shares are removed from treasury shares on a FIFO basis.
Any difference between the cost and the cash received at the time
treasury shares are issued, is recorded in capital in excess of par value,
except in the situation in which the cash received is lower than cost, and
capital in excess of par has been depleted.
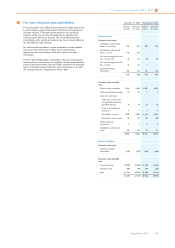
The following transactions took place resulting from employee option
and share plans:
2009 2010
Shares acquired 2,128 15,237
Average market price EUR 19.10 EUR 25.35
Amount paid − −
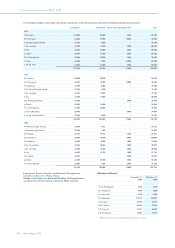
Shares delivered 4,477,364 5,397,514
Average market price EUR 13.76 EUR 23.99
Amount received EUR 32 million EUR 71 million
Total shares in treasury at
year-end 43,102,679 37,720,402
Total cost EUR 1,162 million EUR 1,051 million
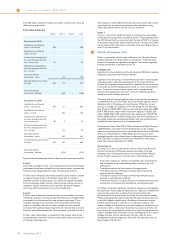
In 2009 and 2010 there were no transactions to reduce share capital:
2009 2010
Shares acquired − −
Average market price − −
Amount paid − −
Reduction of capital stock − −
Total shares in treasury at
year-end 1,851,998 1,851,998
Total cost EUR 25 million EUR 25 million
Net income
A proposal will be submitted to the General Meeting of Shareholders to
pay a dividend of EUR 0.75 per common share, in cash or shares at the
option of the shareholder, against the net income for 2010.
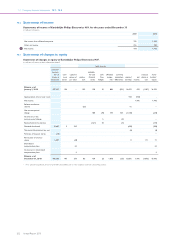
Legal reserves
As of December 31, 2010, legal reserves relate to the revaluation of
assets and liabilities of acquired companies in the context of multi-stage
acquisitions of EUR 86 million (2009: EUR 102 million), unrealized gains
on available-for-sale financial assets of EUR 139 million (2009: EUR 120
million), unrealized losses on cash flow hedges of EUR 5 million (2009:
unrealized gains of EUR 10 million), ‘affiliated companies’ of EUR 1,078
million (2009: EUR 884 million) and currency translation losses of EUR
65 million (2009: EUR 591 million).
The item ‘affiliated companies’ relates to the ‘wettelijke reserve
deelnemingen’, which is required by Dutch law.This reserve relates to
any legal or economic restrictions on the ability of affiliated companies
to transfer funds to the parent company in the form of dividends.
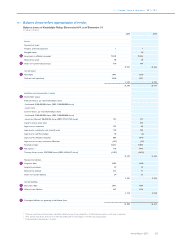
Limitations in the distribution of shareholders’ equity
Pursuant to Dutch law, limitations exist relating to the distribution of
shareholders’ equity of EUR 1,500 million (2009: EUR 1,310 million). As
at December 31, 2010, such limitations relate to common shares of
EUR 197 million (2009: EUR 194 million) as well as to legal reserves
included under ‘revaluation’ of EUR 86 million (2009: EUR 102 million),
available-for-sale financial assets of EUR 139 million (2009: 120 million)
and ‘affiliated companies’ of EUR 1,078 million (2009: EUR 884 million).
In 2009, limitations in the distribution were also affected by gains
related to cash flow hedges of EUR 10 million.
In general, gains related to available-for-sale financial assets, cash flow
hedges and currency translation differences cannot be distributed as
part of shareholders’ equity as they form part of the legal reserves
protected under Dutch law. By their nature, losses relating to available-
for-sale financial assets, cash flow hedges and currency translation
differences, reduce shareholders’ equity, and thereby distributable
amounts.