Philips 2010 Annual Report Download - page 75
Download and view the complete annual report
Please find page 75 of the 2010 Philips annual report below. You can navigate through the pages in the report by either clicking on the pages listed below, or by using the keyword search tool below to find specific information within the annual report.-
 1
1 -
2
-
3
-
4
-
5
-
6
-
7
-
8
-
9
-
10
-
11
-
12
-
13
-
14
-
15
-
16
-
17
-
18
-
19
-
20
-
21
-
22
-
23
-
24
-
25
-
26
-
27
-
28
-
29
-
30
-
31
-
32
-
33
-
34
-
35
-
36
-
37
-
38
-
39
-
40
-
41
-
42
-
43
-
44
-
45
-
46
-
47
-
48
-
49
-
50
-
51
-
52
-
53
-
54
-
55
-
56
-
57
-
58
-
59
-
60
-
61
-
62
-
63
-
64
-
 65
65 -
 66
66 -
 67
67 -
 68
68 -
 69
69 -
 70
70 -
 71
71 -
 72
72 -
 73
73 -
 74
74 -
 75
75 -
 76
76 -
 77
77 -
 78
78 -
 79
79 -
 80
80 -
 81
81 -
 82
82 -
 83
83 -
 84
84 -
 85
85 -
86
-
87
-
88
-
89
-
90
-
91
-
92
-
93
-
94
-
95
-
96
-
97
-
98
-
99
-
100
-
101
-
102
-
103
-
104
-
105
-
106
-
107
-
108
-
109
-
110
-
111
-
112
-
113
-
114
-
115
-
116
-
117
-
118
-
119
-
120
-
121
-
122
-
123
-
124
-
125
-
126
-
127
-
128
-
129
-
130
-
131
-
132
-
133
-
134
-
135
-
136
-
137
-
138
-
139
-
140
-
141
-
142
-
143
-
144
-
145
-
146
-
147
-
148
-
149
-
150
-
151
-
152
-
153
-
154
-
155
-
156
-
157
-
158
-
159
-
160
-
161
-
162
-
163
-
164
-
165
-
166
-
167
-
168
-
169
-
170
-
171
-
172
-
173
-
174
-
175
-
176
-
177
-
178
-
179
-
180
-
181
-
182
-
183
-
184
-
185
-
186
-
187
-
188
-
189
-
190
-
191
-
192
-
193
-
194
-
195
-
196
-
197
-
198
-
199
-
200
-
201
-
202
-
203
-
204
-
205
-
206
-
207
-
208
-
209
-
210
-
211
-
212
-
213
-
214
-
215
-
216
-
217
-
218
-
219
-
220
-
221
-
222
-
223
-
224
-
225
-
226
-
227
-
228
-
229
-
230
-
231
-
232
-
233
-
234
-
235
-
236
-
237
-
238
-
239
-
240
-
241
-
242
-
243
-
244
-
245
-
246
-
247
-
248
-
249
-
250
 |
 |

5 Group performance 5.4.2 - 5.4.2
Annual Report 2010 75
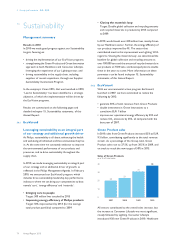
and Lighting increased the share of Green Product sales
with the introduction of 5 and 1,300 new Green Products
respectively.
Overall, environmental improvements have been
predominantly realized in energy efficiency of products,
one of the Green Focal Areas in our EcoDesign process.
Green Product sales by sector
in millions of euros
Healthcare
2,136
Consumer Lifestyle
3,024
Lighting
4,376
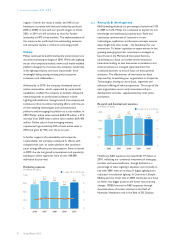
Green Innovations
In 2010, Philips invested over EUR 450 million in Green
Innovations – the Research & Development spend related
to the development of new generations of Green
Products and Green Technologies. This was the highest
amount invested since we started EcoVision4 in 2007 –
and as a result we achieved the 2012 target of EUR 1
billion cumulative invested in Green Innovations two
years ahead of schedule. To maintain our Green
Innovations momentum, we strive to invest a cumulative
EUR 2 billion during the coming five years.
Philips Healthcare innovation projects consider all of the
Green Focal Areas and aim to reduce total life cycle
impact. In particular, the sector focuses on reducing
energy consumption, weight and radiation dose.
Consumer Lifestyle’s investment in Green Innovations is
dedicated to the development of new Green Products,
focusing on further enhancing energy efficiency and on
closing material loops. Green Innovations at Consumer
Lifestyle amounted to EUR 115 million and the sector
worked on the voluntarily phase-out of polyvinyl chloride
(PVC) and brominated flame retardants (BFR), enabling
our Lifestyle Entertainment and Personal Care businesses
to launch products which are completely free of these
substances. Another result of Consumer Lifestyle’s Green
Innovation activities is, for example, the award-winning
Econova LED TV.
The Lighting sector accounts for over half of the total
spend on Green Innovations and also contributes to some
45% of Philips Green Product sales. The focus is on
developing new energy-efficient lighting solutions, further
enhancing current Green Products and driving toward
technological breakthroughs, such as solid-state lighting.
Corporate Technologies invested approximately EUR 46
million on a Green Innovation activity portfolio mainly
focused on energy efficiency, and reduction of waste and
water consumption.
Green Innovation investment
in millions of euros
Healthcare
60
Consumer
Lifestyle
115
Lighting
230
Corporate Technologies
46
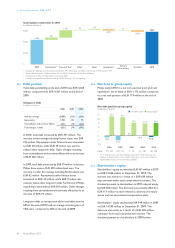
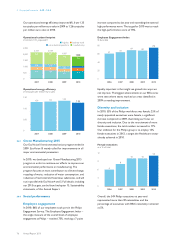
Operational carbon footprint and energy
efficiency
In 2010, we took another good step in reaching our target
of 25% CO2 reduction, as operational CO2 emissions
decreased 7%. CO2 emissions from manufacturing
decreased 17% due to a number of reasons, such as our
ongoing energy efficiency program, the changing industrial
footprint and mainly by the increase in purchased
electricity from renewable sources. CO2 emissions from
non-industrial sites decreased 26%, partly because of our
continued focus on the most efficient use of facility space,
for instance with our Work Place Innovation program
(which enables flex-working), but also due to the
increased share of purchased electricity from renewable
sources.
With sales picking up, the number of travel movements
increased as well, resulting in an increase of CO2
emissions from business travel of 13%. We continue
promoting videoconferencing and maintaining our green
lease car policy. Therefore, emissions from business travel
are still 11% below the level of 2007, the base year for our
target setting. CO2 emissions from logistics increased 8%,
because the number of products transported was higher
than in 2009. Nonetheless, the emissions are 7% lower
than in 2007, because of our continued focus on efficient
container utilization, reducing mileage in road freight, and
the shift from air to sea freight.