Philips 2010 Annual Report Download - page 210
Download and view the complete annual report
Please find page 210 of the 2010 Philips annual report below. You can navigate through the pages in the report by either clicking on the pages listed below, or by using the keyword search tool below to find specific information within the annual report.-
 1
1 -
2
-
3
-
4
-
5
-
6
-
7
-
8
-
9
-
10
-
11
-
12
-
13
-
14
-
15
-
16
-
17
-
18
-
19
-
20
-
21
-
22
-
23
-
24
-
25
-
26
-
27
-
28
-
29
-
30
-
31
-
32
-
33
-
34
-
35
-
36
-
37
-
38
-
39
-
40
-
41
-
42
-
43
-
44
-
45
-
46
-
47
-
48
-
49
-
50
-
51
-
52
-
53
-
54
-
55
-
56
-
57
-
58
-
59
-
60
-
61
-
62
-
63
-
64
-
65
-
66
-
67
-
68
-
69
-
70
-
71
-
72
-
73
-
74
-
75
-
76
-
77
-
78
-
79
-
80
-
81
-
82
-
83
-
84
-
85
-
86
-
87
-
88
-
89
-
90
-
91
-
92
-
93
-
94
-
95
-
96
-
97
-
98
-
99
-
100
-
101
-
102
-
103
-
104
-
105
-
106
-
107
-
108
-
109
-
110
-
111
-
112
-
113
-
114
-
115
-
116
-
117
-
118
-
119
-
120
-
121
-
122
-
123
-
124
-
125
-
126
-
127
-
128
-
129
-
130
-
131
-
132
-
133
-
134
-
135
-
136
-
137
-
138
-
139
-
140
-
141
-
142
-
143
-
144
-
145
-
146
-
147
-
148
-
149
-
150
-
151
-
152
-
153
-
154
-
155
-
156
-
157
-
158
-
159
-
160
-
161
-
162
-
163
-
164
-
165
-
166
-
167
-
168
-
169
-
170
-
171
-
172
-
173
-
174
-
175
-
176
-
177
-
178
-
179
-
180
-
181
-
182
-
183
-
184
-
185
-
186
-
187
-
188
-
189
-
190
-
191
-
192
-
193
-
194
-
195
-
196
-
197
-
198
-
199
-
 200
200 -
 201
201 -
 202
202 -
 203
203 -
 204
204 -
 205
205 -
 206
206 -
 207
207 -
 208
208 -
 209
209 -
 210
210 -
 211
211 -
 212
212 -
 213
213 -
 214
214 -
 215
215 -
 216
216 -
 217
217 -
 218
218 -
 219
219 -
 220
220 -
221
-
222
-
223
-
224
-
225
-
226
-
227
-
228
-
229
-
230
-
231
-
232
-
233
-
234
-
235
-
236
-
237
-
238
-
239
-
240
-
241
-
242
-
243
-
244
-
245
-
246
-
247
-
248
-
249
-
250
 |
 |

15 Sustainability statements 15 - 15.2
210 Annual Report 2010
industrial sites not yet reporting in EcoVision are calculated on the
same basis as described in Scope 1. Indirect emissions of non-
industrial sites are calculated in the same manner as described in
Scope 1.
•Scope 3 – other CO2 emissions related to activities not owned or
controlled by the Group is reported on for our business travel and
distribution activities. Commuting by our employees, upstream
distribution (before suppliers ship to us), outsourced activities and
emissions resulting from product use by our customers are not
included in our operational carbon footprint. The calculations for
business travel by lease cars are based on actual fuel usage and for
rental cars on distance traveled. Emissions from business travel by
airplane are calculated by the supplier based on mileage flown and
emission factors from DEFRA (UK Department of Environment,
Food and Rural Affairs) distinguishing between short, medium and
long flights. Further, emissions from air freight for distribution are
calculated based on the amount of ton-kilometers transported
between airports (distinguishing between short, medium and long
hauls), including an estimate (based on actual data of the lanes with
the largest volumes) for trucking from sites and distribution centers
to airports and vice versa. Express shipments are generally a mix of
road and air transport, depending on the distance. Therefore the
assumption is applied that shipments over less than 600 km are
transported by road and the rest of the shipments by air (those
emissions by air are calculated in the same way as air freight). For sea
transport, only data on transported volume were available so an
estimate had to be made about the average weight of a container.
Transportation to and from ports is not registered. This fore and aft
part of sea transport was estimated to be around 3% of the total
distance (based on actual data of the lanes with the largest volumes),
consisting of a mix of modalities, and was added to the total
emissions accordingly. CO2 emissions from road transport were also
calculated based on ton-kilometers. If data were incomplete, the
emissions were estimated based on sales volumes. Return travel of
vehicles is not included in the data for sea and road distribution.
Health and safety
Health and safety data are reported monthly and validated on a half-
yearly basis. The focus is on reporting work-related injuries, which
predominantly occur in manufacturing operations. The annual number
of cases leading to at least one lost workday is reported per 100 FTEs
(full-time equivalents).
Supplier audits
Supplier audits are primarily focused on identified risk suppliers, based
on identified risk countries and on spend of more than EUR 100,000.
• Based on the Maplecroft Human Rights Risk Indexes, risk countries
for Supply Management in 2010 were the same as in 2009: Belarus,
Brazil, China, India, Indonesia, Mexico, Pakistan, Philippines, Russia,
Thailand, Ukraine and Vietnam.
• Suppliers of new ventures are included to the extent that the
integration process of these ventures has been finalized. Normative
integration period is two years after closure of the new venture.
External assurance
KPMG has provided limited assurance on whether the information in
this section Sustainability statements is fairly stated. We refer to
KPMG’s section 15.7, Independent assurance report, of this Annual
Report.
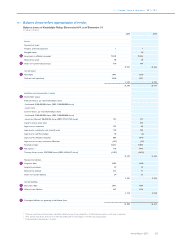
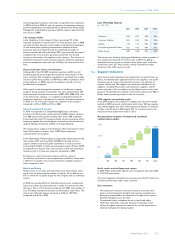
15.1 Economic indicators
This section provides summarized information on contributions on an
accruals basis to the most important economic stakeholders as a basis
to drive economic growth. For a full understanding of each of these
indicators, please refer to the financial statements and notes in this
report.
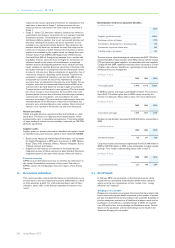
Distribution of direct economic benefits
in millions of euros
2010
Suppliers: goods and services 15,873
Employees: salaries and wages 5,190
Shareholders: distribution from retained earnings 650
Government: corporate income taxes 509
Capital providers: net interest 225
The total amount of purchased goods and services was EUR 15.9 billion,
representing 62% of total revenues of the Philips Group. Of this amount
71% was spent with global suppliers, the remainder with local suppliers.
Compared with 2009, spending in absolute terms increased as a result
of higher sales volumes. Spending as a percentage of sales decreased,
reflecting strict cost management.
in millions of euros
2008 2009 2010
Total supply spend 17,938 15,110 15,873
In 2010 the salaries and wages totaled EUR 5.2 billion. This amount is
about EUR 115 million higher than in 2009, mainly caused by the
increase in employees. Please refer to note 1 for more information.
in millions of euros
2008 2009 2010
Total salaries and wages 5,094 5,075 5,190
Dividend to shareholders amounted to EUR 650 million, comparable to
2009.
in millions of euros
2008 2009 2010
Dividend distributed 720 647 650
Corporate income taxes increased significantly from EUR 100 million in
2009 to EUR 509 million in 2010, mainly attributable to higher taxable
earnings. For a further understanding, please refer to note 3.
in millions of euros
2008 2009 2010
Corporate income taxes 256 100 509
15.2 EcoVision5
In February 2010, we announced our EcoVision5 program, which
includes three sustainability leadership key performance indicators
where we bring our competencies to bear, namely ‘care’, ‘energy
efficiency’ and ‘materials’.
Bringing care to people
Bringing care to people is a parameter that is based on the products that
have a direct relation with health, expressed as the number of people
per year that benefit from those products (‘lives touched’). Examples of
product categories involved are all healthcare products, water and air
purification, oral healthcare, and light therapy. In 2010, we touched
over 420 million lives, mainly through our Healthcare sector. Further
details on this parameter and the methodology can be found in the
document ‘Bringing care to people’.