Philips 2010 Annual Report Download - page 197
Download and view the complete annual report
Please find page 197 of the 2010 Philips annual report below. You can navigate through the pages in the report by either clicking on the pages listed below, or by using the keyword search tool below to find specific information within the annual report.-
 1
1 -
2
-
3
-
4
-
5
-
6
-
7
-
8
-
9
-
10
-
11
-
12
-
13
-
14
-
15
-
16
-
17
-
18
-
19
-
20
-
21
-
22
-
23
-
24
-
25
-
26
-
27
-
28
-
29
-
30
-
31
-
32
-
33
-
34
-
35
-
36
-
37
-
38
-
39
-
40
-
41
-
42
-
43
-
44
-
45
-
46
-
47
-
48
-
49
-
50
-
51
-
52
-
53
-
54
-
55
-
56
-
57
-
58
-
59
-
60
-
61
-
62
-
63
-
64
-
65
-
66
-
67
-
68
-
69
-
70
-
71
-
72
-
73
-
74
-
75
-
76
-
77
-
78
-
79
-
80
-
81
-
82
-
83
-
84
-
85
-
86
-
87
-
88
-
89
-
90
-
91
-
92
-
93
-
94
-
95
-
96
-
97
-
98
-
99
-
100
-
101
-
102
-
103
-
104
-
105
-
106
-
107
-
108
-
109
-
110
-
111
-
112
-
113
-
114
-
115
-
116
-
117
-
118
-
119
-
120
-
121
-
122
-
123
-
124
-
125
-
126
-
127
-
128
-
129
-
130
-
131
-
132
-
133
-
134
-
135
-
136
-
137
-
138
-
139
-
140
-
141
-
142
-
143
-
144
-
145
-
146
-
147
-
148
-
149
-
150
-
151
-
152
-
153
-
154
-
155
-
156
-
157
-
158
-
159
-
160
-
161
-
162
-
163
-
164
-
165
-
166
-
167
-
168
-
169
-
170
-
171
-
172
-
173
-
174
-
175
-
176
-
177
-
178
-
179
-
180
-
181
-
182
-
183
-
184
-
185
-
186
-
 187
187 -
 188
188 -
 189
189 -
 190
190 -
 191
191 -
 192
192 -
 193
193 -
 194
194 -
 195
195 -
 196
196 -
 197
197 -
 198
198 -
 199
199 -
 200
200 -
 201
201 -
 202
202 -
 203
203 -
 204
204 -
 205
205 -
 206
206 -
 207
207 -
208
-
209
-
210
-
211
-
212
-
213
-
214
-
215
-
216
-
217
-
218
-
219
-
220
-
221
-
222
-
223
-
224
-
225
-
226
-
227
-
228
-
229
-
230
-
231
-
232
-
233
-
234
-
235
-
236
-
237
-
238
-
239
-
240
-
241
-
242
-
243
-
244
-
245
-
246
-
247
-
248
-
249
-
250
 |
 |

13 Group financial statements 13.11 - 13.11
Annual Report 2010 197
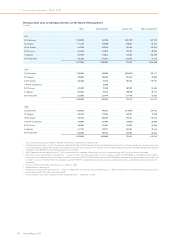
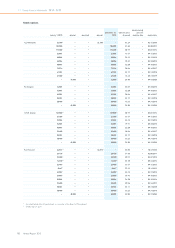
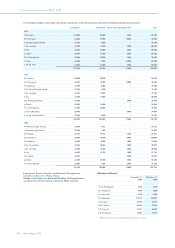
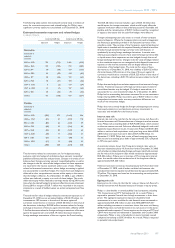
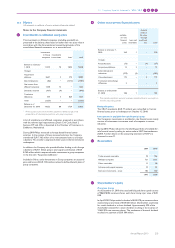
The following table outlines the estimated nominal value in millions of
euros for transaction exposure and related hedges for Philips’ most
significant currency exposures consolidated as of December 31, 2010:
Estimated transaction exposure and related hedges
in millions of euros
maturity 0-60 days maturity over 60 days
exposure hedges exposure hedges
Receivables
Functional vs
exposure
currency
EUR vs. USD 734 (712) 1,405 (955)
USD vs. EUR 173 (132) 759 (409)
EUR vs. JPY 39 (39) 164 (127)
EUR vs. GBP 44 (39) 144 (85)
USD vs. JPY 38 (26) 122 (62)
EUR vs. PLN 38 (31) 104 (56)
CNY vs. EUR 4 (2) 119 (24)
CNY vs. USD 12 (7) 107 (65)
EUR vs. SEK 38 (32) 78 (45)
Others 171 (138) 437 (227)
Payables
Functional vs
exposure
currency
EUR vs. USD (982) 972 (1,641) 946
USD vs. CNY (57) 57 (219) 118
BRL vs. USD (83) 66 (123) 59
EUR vs. PLN (48) 39 (156) 84
GBP vs. EUR (25) 20 (122) 64
CNY vs. EUR (18) 13 (106) 51
IDR vs. USD (21) 15 (98) 51
USD vs. SGD (17) 12 (84) 43
Others (290) 258 (524) 320
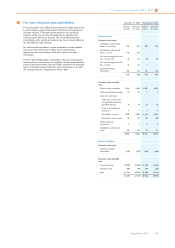
The derivatives related to transactions are, for hedge accounting
purposes, split into hedges of on-balance-sheet accounts receivable/
payable and forecasted sales and purchases. Changes in the value of on-
balance-sheet foreign-currency accounts receivable/payable, as well as
the changes in the fair value of the hedges related to these exposures,
are reported in the income statement under costs of sales. Hedges
related to forecasted transactions, where hedge accounting is applied,
are accounted for as cash flow hedges. The results from such hedges are
deferred in other comprehensive income within equity to the extent
that the hedge is effective. As of December 31, 2010, a gain of EUR 5
million was deferred in equity as a result of these hedges. The result
deferred in equity will be released to earnings mostly during 2011 at the
time when the related hedged transactions affect the income statement.
During 2010, a net gain of EUR 7 million was recorded in the income
statement as a result of ineffectiveness on certain anticipated cash flow
hedges.
The total net fair value of hedges related to transaction exposure as of
December 31, 2010 was an unrealized liability of EUR 29 million. An
instantaneous 10% increase in the value of the euro against all
currencies would lead to an increase of EUR 20 million in the value of
the derivatives; including a EUR 68 million increase related to foreign
exchange transactions of the euro against the US dollar, offset by a EUR
14 million decrease related to foreign exchange transactions of the euro
against the Japanese yen, and a EUR 14 million decrease related to
foreign exchange transactions of the euro against the Pound sterling.
The EUR 20 million increase includes a gain of EUR 33 million that
would impact the income statement, which would largely offset the
opposite revaluation effect on the underlying accounts receivable and
payable, and the remaining loss of EUR 13 million would be recognized
in equity to the extent that the cash flow hedges were effective.
Foreign exchange exposure also arises as a result of inter-company
loans and deposits. Where the Company enters into such arrangements
the financing is generally provided in the functional currency of the
subsidiary entity. The currency of the Company’s external funding and
liquid assets is matched with the required financing of subsidiaries either
directly through external foreign currency loans and deposits, or
synthetically by using foreign exchange derivatives. In certain cases
where group companies may also have external foreign currency debt
or liquid assets, these exposures are also hedged through the use of
foreign exchange derivatives. Changes in the fair value of hedges related
to this translation exposure are recognized within financial income and
expenses in the income statement and are largely offset by the
revaluation of the hedged items. The total net fair value of these
derivatives as of December 31, 2010, was a liability of EUR 425 million.
An instantaneous 10% increase in the value of the euro against all
currencies would lead to a increase of EUR 323 million in the value of
the derivatives, including a EUR 315 million increase related to the US
dollar.
Philips does not hedge the translation exposure of net income in foreign
entities. Translation exposure of foreign-currency equity invested in
consolidated entities may be hedged. If a hedge is entered into, it is
accounted for as a net investment hedge. As of December 31, 2010,
Philips had no outstanding derivatives accounted for as net investment
hedges. During 2010, Philips recorded a gain of EUR 9 million in other
comprehensive income under currency translation differences as a
result of net investment hedges.
Philips does not currently hedge the foreign exchange exposure arising
from equity interests in non-functional-currency investments in
associates and available-for-sale financial assets.
Interest rate risk
Interest rate risk is the risk that the fair value or future cash flows of a
financial instrument will fluctuate because of changes in market interest
rates. Philips had outstanding debt of EUR 4,658 million, which created
an inherent interest rate risk. Failure to effectively hedge this risk could
negatively impact financial results. At year-end, Philips held EUR 5,833
million in cash and cash equivalents, total gross long-term debt of EUR
2,818 million and total short-term debt of EUR 1,840 million. At
December 31, 2010, Philips had a ratio of fixed-rate gross long-term
debt to total outstanding gross debt of approximately 55%, compared
to 73% one year earlier.
A sensitivity analysis shows that if long-term interest rates were to
decrease instantaneously by 1% from their level of December 31, 2010,
with all other variables (including foreign exchange rates) held constant,
the fair value of the long-term debt would increase by approximately
EUR 226 million. If there was an increase of 1% in long-term interest
rates, this would reduce the market value of the long-term debt by
approximately EUR 226 million.
If interest rates were to increase instantaneously by 1% from their level
of December 31, 2010, with all other variables held constant, the
annualized net interest expense would decrease by approximately EUR
39 million. This impact was based on the outstanding net cash position
at December 31, 2010.
Equity price risk
Equity price risk is the risk that the fair value or future cash flows of a
financial instrument will fluctuate because of changes in equity prices.
Philips is a shareholder in several publicly listed companies, including
TCL Corporation and TPV Technology Ltd. As a result, Philips is
exposed to potential financial loss through movements in their share
prices. The aggregate equity price exposure of publicly listed
investments in its main available-for-sale financial assets amounted to
approximately EUR 270 million at year-end 2010 (2009: EUR 357
million including investments in associates shares that were sold during
2010). Philips does not hold derivatives in its own stock or in the above-
mentioned listed companies. The two options on the shares of TPV and
CBAY were matured and redeemed in September and October 2010
respectively. Philips is also a shareholder in several privately owned
companies amounting to EUR 24 million. As a result, Philips is exposed
to potential value adjustments.