Philips 2010 Annual Report Download - page 68
Download and view the complete annual report
Please find page 68 of the 2010 Philips annual report below. You can navigate through the pages in the report by either clicking on the pages listed below, or by using the keyword search tool below to find specific information within the annual report.-
 1
1 -
2
-
3
-
4
-
5
-
6
-
7
-
8
-
9
-
10
-
11
-
12
-
13
-
14
-
15
-
16
-
17
-
18
-
19
-
20
-
21
-
22
-
23
-
24
-
25
-
26
-
27
-
28
-
29
-
30
-
31
-
32
-
33
-
34
-
35
-
36
-
37
-
38
-
39
-
40
-
41
-
42
-
43
-
44
-
45
-
46
-
47
-
48
-
49
-
50
-
51
-
52
-
53
-
54
-
55
-
56
-
57
-
 58
58 -
 59
59 -
 60
60 -
 61
61 -
 62
62 -
 63
63 -
 64
64 -
 65
65 -
 66
66 -
 67
67 -
 68
68 -
 69
69 -
 70
70 -
 71
71 -
 72
72 -
 73
73 -
 74
74 -
 75
75 -
 76
76 -
 77
77 -
 78
78 -
79
-
80
-
81
-
82
-
83
-
84
-
85
-
86
-
87
-
88
-
89
-
90
-
91
-
92
-
93
-
94
-
95
-
96
-
97
-
98
-
99
-
100
-
101
-
102
-
103
-
104
-
105
-
106
-
107
-
108
-
109
-
110
-
111
-
112
-
113
-
114
-
115
-
116
-
117
-
118
-
119
-
120
-
121
-
122
-
123
-
124
-
125
-
126
-
127
-
128
-
129
-
130
-
131
-
132
-
133
-
134
-
135
-
136
-
137
-
138
-
139
-
140
-
141
-
142
-
143
-
144
-
145
-
146
-
147
-
148
-
149
-
150
-
151
-
152
-
153
-
154
-
155
-
156
-
157
-
158
-
159
-
160
-
161
-
162
-
163
-
164
-
165
-
166
-
167
-
168
-
169
-
170
-
171
-
172
-
173
-
174
-
175
-
176
-
177
-
178
-
179
-
180
-
181
-
182
-
183
-
184
-
185
-
186
-
187
-
188
-
189
-
190
-
191
-
192
-
193
-
194
-
195
-
196
-
197
-
198
-
199
-
200
-
201
-
202
-
203
-
204
-
205
-
206
-
207
-
208
-
209
-
210
-
211
-
212
-
213
-
214
-
215
-
216
-
217
-
218
-
219
-
220
-
221
-
222
-
223
-
224
-
225
-
226
-
227
-
228
-
229
-
230
-
231
-
232
-
233
-
234
-
235
-
236
-
237
-
238
-
239
-
240
-
241
-
242
-
243
-
244
-
245
-
246
-
247
-
248
-
249
-
250
 |
 |

5 Group performance 5.2.4 - 5.2.7
68 Annual Report 2010
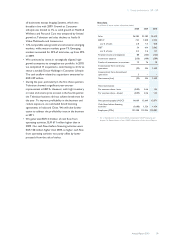
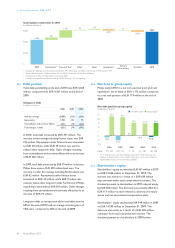
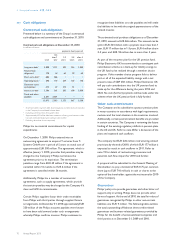
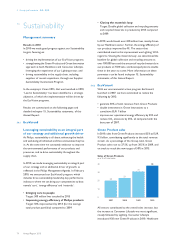
Cash balance movements in 2010
in millions of euros
6,000
4,000
2,000
0
4,386
2009
385
Divestments1)
1,333
Free cash flow2)
64
Other3)
135
Debt
(239)
Acquisitions4)
65
Treasury
share delivery
(296)
Dividend
5,833
2010
1) Includes the redemption of convertible bonds from TPV Technology and CBAY and the sale of 9.4% shares in TPV
2) Please refer to chapter 16, Reconciliation of non-GAAP information, of this Annual Report
3) Includes cash outflow for derivatives and currency effect
4) Includes the acquisitions of Discus Holdings, NCW Holdings LTD and medSage
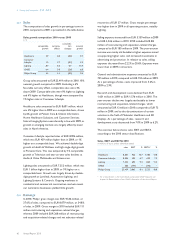
5.2.5 Debt position
Total debt outstanding at the end of 2010 was EUR 4,658
million, compared with EUR 4,267 million at the end of
2009.
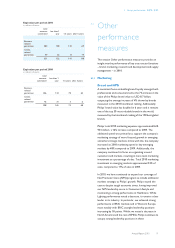
Changes in debt
in millions of euros
2008 2009 2010
New borrowings (2,088) (312) (214)
Repayments 1,708 252 79
Consolidation and currency effects (245) (19) (256)
Total changes in debt (625) (79) (391)
In 2010, total debt increased by EUR 391 million. The
increase in borrowings including finance leases was EUR
214 million. Repayments under finance leases amounted
to EUR 50 million, while EUR 29 million was used to
reduce other long-term debt. Other changes resulting
from consolidation and currency effects led to an increase
of EUR 256 million.
In 2009, total debt increased by EUR 79 million. In January,
Philips drew upon a EUR 250 million bank loan. The
increase in other borrowings including finance leases was
EUR 62 million. Repayments under finance leases
amounted to EUR 42 million, while EUR 9 million was
used to reduce other long-term debt. Furthermore Philips
repaid short-term debt of EUR 201 million. Other changes
resulting from consolidation and currency effects led to an
increase of EUR 19 million.
Long-term debt as a proportion of the total debt stood at
60% at the end of 2010 with an average remaining term of
10.8 years, compared to 85% at the end of 2009.
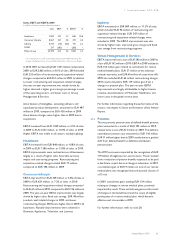
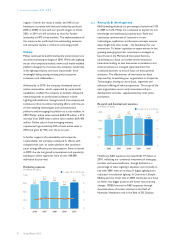
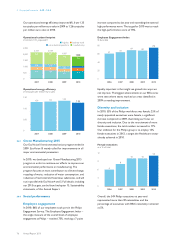
5.2.6 Net debt to group equity
Philips ended 2010 in a net cash position (cash and cash
equivalents, net of debt) of EUR 1,175 million, compared
to a net cash position of EUR 119 million at the end of
2009.
Net debt (cash) to group equity1)
in billions of euros ■-net debt (cash)--■-group equity2)
25
20
15
10
5
0
(5)
(10)
(2.0)
23.2
(9) : 109
2006
(5.2)
21.9
(31) : 131
2007
0.6
15.6
4 : 96
2008
(0.1)
14.6
(1) : 101
2009
(1.2)
15.1
(8) : 108
2010
ratio:
1) For a reconciliation to the most directly comparable GAAP measures, see
chapter 16, Reconciliation of non-GAAP information, of this Annual Report
2) Shareholders’ equity and non-controlling interests
5.2.7 Shareholders’ equity
Shareholders’ equity increased by EUR 451 million in 2010
to EUR 15,046 million at December 31, 2010. The
increase was mainly as a result of a EUR 630 million
improvement within total comprehensive income. The
dividend payment to shareholders in 2010 reduced equity
by EUR 304 million. The decrease was partially offset by a
EUR 111 million increase related to delivery of treasury
shares and net share-based compensation plans.
Shareholders’ equity declined by EUR 949 million in 2009
to EUR 14,595 million at December 31, 2009. The
decrease was mainly as a result of a EUR 404 million
reduction from total comprehensive income. The
dividend payment to shareholders in 2009 further