Regions Bank 2011 Annual Report Download - page 100
Download and view the complete annual report
Please find page 100 of the 2011 Regions Bank annual report below. You can navigate through the pages in the report by either clicking on the pages listed below, or by using the keyword search tool below to find specific information within the annual report.-
 1
1 -
2
-
3
-
4
-
5
-
6
-
7
-
8
-
9
-
10
-
11
-
12
-
13
-
14
-
15
-
16
-
17
-
18
-
19
-
20
-
21
-
22
-
23
-
24
-
25
-
26
-
27
-
28
-
29
-
30
-
31
-
32
-
33
-
34
-
35
-
36
-
37
-
38
-
39
-
40
-
41
-
42
-
43
-
44
-
45
-
46
-
47
-
48
-
49
-
50
-
51
-
52
-
53
-
54
-
55
-
56
-
57
-
58
-
59
-
60
-
61
-
62
-
63
-
64
-
65
-
66
-
67
-
68
-
69
-
70
-
71
-
72
-
73
-
74
-
75
-
76
-
77
-
78
-
79
-
80
-
81
-
82
-
83
-
84
-
85
-
86
-
87
-
88
-
89
-
 90
90 -
 91
91 -
 92
92 -
 93
93 -
 94
94 -
 95
95 -
 96
96 -
 97
97 -
 98
98 -
 99
99 -
 100
100 -
 101
101 -
 102
102 -
 103
103 -
 104
104 -
 105
105 -
 106
106 -
 107
107 -
 108
108 -
 109
109 -
 110
110 -
111
-
112
-
113
-
114
-
115
-
116
-
117
-
118
-
119
-
120
-
121
-
122
-
123
-
124
-
125
-
126
-
127
-
128
-
129
-
130
-
131
-
132
-
133
-
134
-
135
-
136
-
137
-
138
-
139
-
140
-
141
-
142
-
143
-
144
-
145
-
146
-
147
-
148
-
149
-
150
-
151
-
152
-
153
-
154
-
155
-
156
-
157
-
158
-
159
-
160
-
161
-
162
-
163
-
164
-
165
-
166
-
167
-
168
-
169
-
170
-
171
-
172
-
173
-
174
-
175
-
176
-
177
-
178
-
179
-
180
-
181
-
182
-
183
-
184
-
185
-
186
-
187
-
188
-
189
-
190
-
191
-
192
-
193
-
194
-
195
-
196
-
197
-
198
-
199
-
200
-
201
-
202
-
203
-
204
-
205
-
206
-
207
-
208
-
209
-
210
-
211
-
212
-
213
-
214
-
215
-
216
-
217
-
218
-
219
-
220
-
221
-
222
-
223
-
224
-
225
-
226
-
227
-
228
-
229
-
230
-
231
-
232
-
233
-
234
-
235
-
236
-
237
-
238
-
239
-
240
-
241
-
242
-
243
-
244
-
245
-
246
-
247
-
248
-
249
-
250
-
251
-
252
-
253
-
254
-
255
-
256
-
257
-
258
-
259
-
260
-
261
-
262
-
263
-
264
-
265
-
266
-
267
-
268
 |
 |
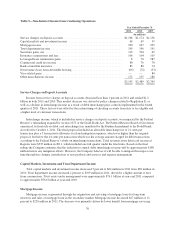
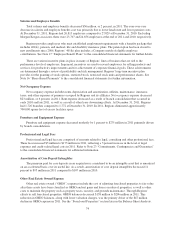
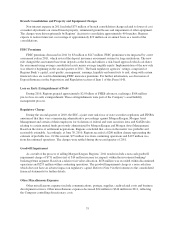
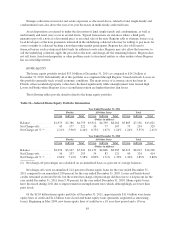
INCOME TAXES
The Company’s income tax benefit from continuing operations for 2011 was $28 million compared to a tax
benefit of $376 million in 2010, resulting in an effective tax rate of (17.4) percent and 44.5 percent, respectively.
The decrease in the income tax benefit was primarily a result of positive consolidated pre-tax earnings and the
goodwill impairment.
The Company’s effective tax rate is affected by recurring items such as affordable housing tax credits, bank-
owned life insurance and tax-exempt income, which are expected to be consistent in the near term. The effective
tax rate is also affected by items that may occur in any given period but are not consistent from period to period,
such as the termination of certain leveraged leases. Accordingly, future period effective tax rates may not be
comparable to the current period.
For 2011, the Company recorded an income tax benefit from discontinued operations of $4 million. In 2011,
a regulatory settlement was finalized and a portion was determined to be deductible for income tax purposes.
This settlement resulted in a $27 million income tax benefit to discontinued operations. In addition, the $492
million goodwill impairment reflected in 2011 discontinued operations resulted in a $14 million income tax
benefit. The 2010 regulatory charge of $125 million reflected in discontinued operations was considered to be
non-deductible at the time of the accrual.
At December 31, 2011, the Company reported a net deferred tax asset of $1.3 billion. Of this amount, $857
million was generated from differences between the financial statement carrying amounts and the corresponding
tax bases of assets and liabilities, of which a significant portion relates to the allowance for loan losses. These net
deferred tax assets have not yet reduced taxable income and therefore do not have a set expiration date. The
remaining $429 million net deferred tax asset balance relates to tax carryforwards that have defined expiration
dates which are typically 15 or 20 years from the date of creation. Of the $429 million, $87 million of this
deferred tax asset is related to tax carryforwards that have expiration dates prior to the tax year 2024. Additional
details related to tax carryforwards, including more information regarding the expiration of various categories of
carryforwards, is included in Note 19 “Income Taxes” to the consolidated financial statements.
Management’s determination of the realization of the net deferred tax asset is based upon an evaluation of
the four possible sources of taxable income: 1) the future reversals of taxable temporary differences; 2) future
taxable income exclusive of reversing temporary differences and carryforwards; 3) taxable income in prior
carryback years; and 4) tax-planning strategies. In making a conclusion, management has evaluated all available
positive and negative evidence impacting these sources of taxable income. The primary sources of positive and
negative evidence impacting taxable income are summarized below.
Positive Evidence
• History of earnings—The Company has a strong history of generating earnings and has demonstrated
positive earnings in 16 of the last 20 years. Absent the goodwill impairments during 2011 and 2008,
which had limited impact on taxable net income reported on the Company’s tax returns, the Company
would have generated positive earnings during these years leaving only 2009 and 2010 in loss
positions. The Company did not generate any federal net operating losses or tax credit carryforwards
until 2009, and in 2011 the Company utilized all federal net operating losses and a portion of the
federal tax credit carryforwards. There is no history of significant tax carryforwards expiring unused.
• Reversals of taxable temporary differences—The Company anticipates that future reversals of taxable
temporary differences, including the accretion of taxable temporary differences related to leveraged
leases acquired in a prior business combination can absorb up to approximately $850 million of
deferred tax assets.
• Creation of future taxable income—At December 31, 2011, the Company utilized all taxable income in
prior carryback years. The Company has projected future taxable income that will be sufficient to
absorb the remaining deferred tax assets after the reversal of future taxable temporary differences. The
taxable income forecasting process utilizes the forecasted pre-tax earnings and adjusts for book-tax
76