Regions Bank 2011 Annual Report Download - page 222
Download and view the complete annual report
Please find page 222 of the 2011 Regions Bank annual report below. You can navigate through the pages in the report by either clicking on the pages listed below, or by using the keyword search tool below to find specific information within the annual report.-
 1
1 -
2
-
3
-
4
-
5
-
6
-
7
-
8
-
9
-
10
-
11
-
12
-
13
-
14
-
15
-
16
-
17
-
18
-
19
-
20
-
21
-
22
-
23
-
24
-
25
-
26
-
27
-
28
-
29
-
30
-
31
-
32
-
33
-
34
-
35
-
36
-
37
-
38
-
39
-
40
-
41
-
42
-
43
-
44
-
45
-
46
-
47
-
48
-
49
-
50
-
51
-
52
-
53
-
54
-
55
-
56
-
57
-
58
-
59
-
60
-
61
-
62
-
63
-
64
-
65
-
66
-
67
-
68
-
69
-
70
-
71
-
72
-
73
-
74
-
75
-
76
-
77
-
78
-
79
-
80
-
81
-
82
-
83
-
84
-
85
-
86
-
87
-
88
-
89
-
90
-
91
-
92
-
93
-
94
-
95
-
96
-
97
-
98
-
99
-
100
-
101
-
102
-
103
-
104
-
105
-
106
-
107
-
108
-
109
-
110
-
111
-
112
-
113
-
114
-
115
-
116
-
117
-
118
-
119
-
120
-
121
-
122
-
123
-
124
-
125
-
126
-
127
-
128
-
129
-
130
-
131
-
132
-
133
-
134
-
135
-
136
-
137
-
138
-
139
-
140
-
141
-
142
-
143
-
144
-
145
-
146
-
147
-
148
-
149
-
150
-
151
-
152
-
153
-
154
-
155
-
156
-
157
-
158
-
159
-
160
-
161
-
162
-
163
-
164
-
165
-
166
-
167
-
168
-
169
-
170
-
171
-
172
-
173
-
174
-
175
-
176
-
177
-
178
-
179
-
180
-
181
-
182
-
183
-
184
-
185
-
186
-
187
-
188
-
189
-
190
-
191
-
192
-
193
-
194
-
195
-
196
-
197
-
198
-
199
-
200
-
201
-
202
-
203
-
204
-
205
-
206
-
207
-
208
-
209
-
210
-
211
-
 212
212 -
 213
213 -
 214
214 -
 215
215 -
 216
216 -
 217
217 -
 218
218 -
 219
219 -
 220
220 -
 221
221 -
 222
222 -
 223
223 -
 224
224 -
 225
225 -
 226
226 -
 227
227 -
 228
228 -
 229
229 -
 230
230 -
 231
231 -
 232
232 -
233
-
234
-
235
-
236
-
237
-
238
-
239
-
240
-
241
-
242
-
243
-
244
-
245
-
246
-
247
-
248
-
249
-
250
-
251
-
252
-
253
-
254
-
255
-
256
-
257
-
258
-
259
-
260
-
261
-
262
-
263
-
264
-
265
-
266
-
267
-
268
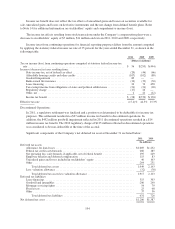
 |
 |

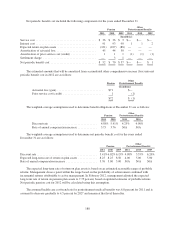
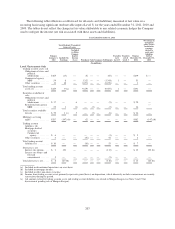
2010
Asset Derivatives Liability Derivatives
Notional
Value Balance Sheet Location Fair Value Balance Sheet Location Fair Value
(In millions)
Derivatives in fair value hedging
relationships:
Interest rate swaps .............. $ 9,230 Other assets $ 226 Other liabilities $ —
Derivatives in cash flow hedging
relationships:
Interest rate swaps .............. 15,680 Other assets 43 Other liabilities 127
Interest rate options ............. 2,000 Other assets 5 Other liabilities —
Total ........................ 17,680 48 127
Total derivatives designated as hedging
instruments ..................... $ 26,910 $ 274 $ 127
Derivatives not designated as hedging
instruments:
Interest rate swaps(1) ............ $ 53,290 Other assets $1,778 Other liabilities $1,823
Interest rate options(2) ........... 4,271 Other assets 40 Other liabilities 29
Interest rate futures and forward
commitments ................ 34,965 Other assets 35 Other liabilities 10
Other contracts ................ 1,331 Other assets 21 Other liabilities 19
Total derivatives not designated as
hedging instruments .............. $ 93,857 $1,874 $1,881
Total derivatives ........... $120,767 $2,148 $2,008
(1) Includes Morgan Keegan amounts of $4,104 million in Notional Value and $269 million in Other Assets/
Other Liabilities
(2) Includes Morgan Keegan amounts of $776 million in Notional Value and $21 million in Other Assets/Other
Liabilities
198