Regions Bank 2011 Annual Report Download - page 9
Download and view the complete annual report
Please find page 9 of the 2011 Regions Bank annual report below. You can navigate through the pages in the report by either clicking on the pages listed below, or by using the keyword search tool below to find specific information within the annual report.-
 1
1 -
 2
2 -
 3
3 -
 4
4 -
 5
5 -
 6
6 -
 7
7 -
 8
8 -
 9
9 -
 10
10 -
 11
11 -
 12
12 -
 13
13 -
 14
14 -
 15
15 -
 16
16 -
 17
17 -
 18
18 -
 19
19 -
 20
20 -
21
-
22
-
23
-
24
-
25
-
26
-
27
-
28
-
29
-
30
-
31
-
32
-
33
-
34
-
35
-
36
-
37
-
38
-
39
-
40
-
41
-
42
-
43
-
44
-
45
-
46
-
47
-
48
-
49
-
50
-
51
-
52
-
53
-
54
-
55
-
56
-
57
-
58
-
59
-
60
-
61
-
62
-
63
-
64
-
65
-
66
-
67
-
68
-
69
-
70
-
71
-
72
-
73
-
74
-
75
-
76
-
77
-
78
-
79
-
80
-
81
-
82
-
83
-
84
-
85
-
86
-
87
-
88
-
89
-
90
-
91
-
92
-
93
-
94
-
95
-
96
-
97
-
98
-
99
-
100
-
101
-
102
-
103
-
104
-
105
-
106
-
107
-
108
-
109
-
110
-
111
-
112
-
113
-
114
-
115
-
116
-
117
-
118
-
119
-
120
-
121
-
122
-
123
-
124
-
125
-
126
-
127
-
128
-
129
-
130
-
131
-
132
-
133
-
134
-
135
-
136
-
137
-
138
-
139
-
140
-
141
-
142
-
143
-
144
-
145
-
146
-
147
-
148
-
149
-
150
-
151
-
152
-
153
-
154
-
155
-
156
-
157
-
158
-
159
-
160
-
161
-
162
-
163
-
164
-
165
-
166
-
167
-
168
-
169
-
170
-
171
-
172
-
173
-
174
-
175
-
176
-
177
-
178
-
179
-
180
-
181
-
182
-
183
-
184
-
185
-
186
-
187
-
188
-
189
-
190
-
191
-
192
-
193
-
194
-
195
-
196
-
197
-
198
-
199
-
200
-
201
-
202
-
203
-
204
-
205
-
206
-
207
-
208
-
209
-
210
-
211
-
212
-
213
-
214
-
215
-
216
-
217
-
218
-
219
-
220
-
221
-
222
-
223
-
224
-
225
-
226
-
227
-
228
-
229
-
230
-
231
-
232
-
233
-
234
-
235
-
236
-
237
-
238
-
239
-
240
-
241
-
242
-
243
-
244
-
245
-
246
-
247
-
248
-
249
-
250
-
251
-
252
-
253
-
254
-
255
-
256
-
257
-
258
-
259
-
260
-
261
-
262
-
263
-
264
-
265
-
266
-
267
-
268
 |
 |
REGIONS 2011 ANNUAL REPORT 7
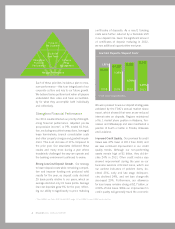
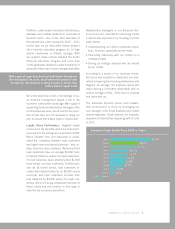
Expense Control. We understand that tightly
controlling expenses during a slow economy is
critical, and Regions remains focused on taking
steps to improve productivity and effi ciency. We
are fundamentally changing our cost culture by
continuously seeking opportunities to improve
and control our expense base, while still mak-
ing the appropriate investments to enhance
our competitive position and remain a superior
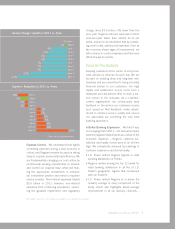
service provider. Non-interest expenses totaled
$3.9 billion in 2011; however, non-interest
expenses from continuing operations3, exclud-
ing the goodwill impairment and regulatory
charge, were $3.6 billion, 5% lower than the
prior year. Regions reduced expenses in 2011
year-over-year faster than almost all of our
peers, and we’ve accomplished that by contain-
ing credit costs, salaries and expenses. Even as
the economy shows signs of improvement, we
will continue to control expenses and fi nd more
effi cient ways to operate.
Focus On The Customer
Keeping customers at the center of every busi-
ness decision is what we do each day. We are
focused on building deep and long-term rela-
tionships and are committed to being a trusted
fi nancial advisor to our customers. Our high
loyalty and satisfaction scores come from a
deliberate and disciplined effort to drive a ser-
vice culture in the company. As a customer-
centric organization, we continuously seek
feedback on the service our customers receive
and, based on that feedback, make adjust-
ments to enhance service quality and ensure
our associates are providing the very best
banking experience.
A Better Banking Experience. We fi nd it very
encouraging that in 2011 – at a time when many
seemed negative toward banks as a result of the
economic downturn – Regions’ customer sat-
isfaction and loyalty scores were at an all-time
high. We consistently achieved top rankings in
customer experience and brand loyalty:
• J.D. Power ranked Regions highest in retail
banking satisfaction in Florida
• Regions ranked among the top 12 banks for
retail banking satisfaction in all fi ve of J.D.
Power’s geographic regions that correspond
with our footprint
• J.D. Power ranked Regions at or above the
industry average in every component of the
study, which also highlights above-average
improvement in all our delivery channels –
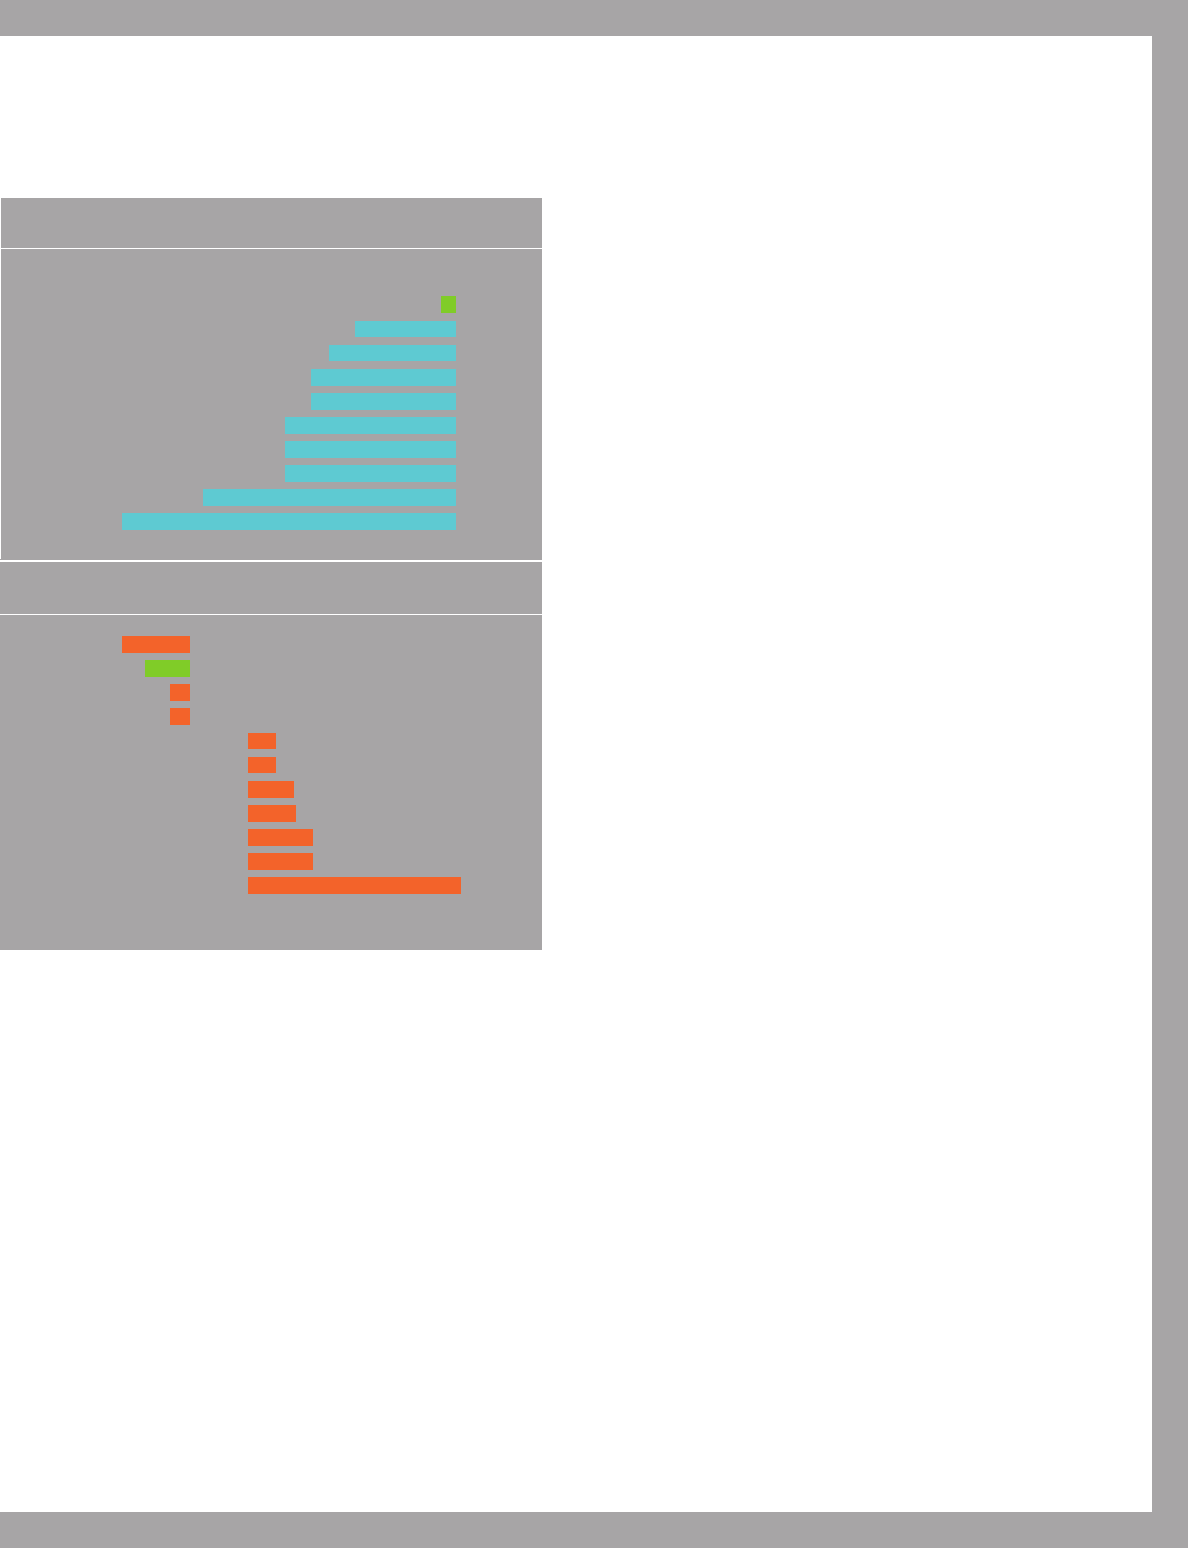
-8%
-5%
-2%
-2%
5%
3%
3%
6%
8%
8%
25%
Reg
i
on
s
B
ank
1
B
ank
3
B
an
k
4
B
an
k
5
B
ank
6
Ba
n
k
7
B
ank
8
B
ank
9
B
ank
1
0
Ba
nk
1
1
0%
-1%
-4%
-5%
-6%
-6%
-7%
-7%
-7%
-10%
-13%
Reg
i
on
s
B
ank
1
B
ank
3
B
an
k
4
B
an
k
5
B
ank
6
B
an
k
7
B
ank
8
B
ank
9
B
an
k
1
0
B
an
k
1
1
Service Charges* Growth in 2011 vs. Peers
Expense* Reduction in 2011 vs. Peers
*From continuing operations
3 Non-GAAP, see Form 10-K Table 6 for GAAP to non-GAAP reconciliation