Regions Bank 2011 Annual Report Download - page 85
Download and view the complete annual report
Please find page 85 of the 2011 Regions Bank annual report below. You can navigate through the pages in the report by either clicking on the pages listed below, or by using the keyword search tool below to find specific information within the annual report.-
 1
1 -
2
-
3
-
4
-
5
-
6
-
7
-
8
-
9
-
10
-
11
-
12
-
13
-
14
-
15
-
16
-
17
-
18
-
19
-
20
-
21
-
22
-
23
-
24
-
25
-
26
-
27
-
28
-
29
-
30
-
31
-
32
-
33
-
34
-
35
-
36
-
37
-
38
-
39
-
40
-
41
-
42
-
43
-
44
-
45
-
46
-
47
-
48
-
49
-
50
-
51
-
52
-
53
-
54
-
55
-
56
-
57
-
58
-
59
-
60
-
61
-
62
-
63
-
64
-
65
-
66
-
67
-
68
-
69
-
70
-
71
-
72
-
73
-
74
-
 75
75 -
 76
76 -
 77
77 -
 78
78 -
 79
79 -
 80
80 -
 81
81 -
 82
82 -
 83
83 -
 84
84 -
 85
85 -
 86
86 -
 87
87 -
 88
88 -
 89
89 -
 90
90 -
 91
91 -
 92
92 -
 93
93 -
 94
94 -
 95
95 -
96
-
97
-
98
-
99
-
100
-
101
-
102
-
103
-
104
-
105
-
106
-
107
-
108
-
109
-
110
-
111
-
112
-
113
-
114
-
115
-
116
-
117
-
118
-
119
-
120
-
121
-
122
-
123
-
124
-
125
-
126
-
127
-
128
-
129
-
130
-
131
-
132
-
133
-
134
-
135
-
136
-
137
-
138
-
139
-
140
-
141
-
142
-
143
-
144
-
145
-
146
-
147
-
148
-
149
-
150
-
151
-
152
-
153
-
154
-
155
-
156
-
157
-
158
-
159
-
160
-
161
-
162
-
163
-
164
-
165
-
166
-
167
-
168
-
169
-
170
-
171
-
172
-
173
-
174
-
175
-
176
-
177
-
178
-
179
-
180
-
181
-
182
-
183
-
184
-
185
-
186
-
187
-
188
-
189
-
190
-
191
-
192
-
193
-
194
-
195
-
196
-
197
-
198
-
199
-
200
-
201
-
202
-
203
-
204
-
205
-
206
-
207
-
208
-
209
-
210
-
211
-
212
-
213
-
214
-
215
-
216
-
217
-
218
-
219
-
220
-
221
-
222
-
223
-
224
-
225
-
226
-
227
-
228
-
229
-
230
-
231
-
232
-
233
-
234
-
235
-
236
-
237
-
238
-
239
-
240
-
241
-
242
-
243
-
244
-
245
-
246
-
247
-
248
-
249
-
250
-
251
-
252
-
253
-
254
-
255
-
256
-
257
-
258
-
259
-
260
-
261
-
262
-
263
-
264
-
265
-
266
-
267
-
268
 |
 |

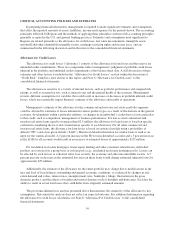
impairment is not indicated and no further testing is required. Conversely, if the fair value of the reporting unit is
below its carrying amount, Step Two must be performed. Step Two consists of determining the implied fair value
of goodwill, which is the net difference between the after-tax valuation of assets and liabilities and the fair value
of the reporting unit (from Step One). Adverse changes in the economic environment, declining operations of the
reporting unit, or other factors could result in a decline in the estimated implied fair value of goodwill. If the
estimated implied fair value is less than the carrying amount, a loss would be recognized to reduce the carrying
amount to the estimated implied fair value.
The fair value of the reporting unit is determined using two approaches and several key assumptions.
Regions utilizes the Capital Asset Pricing Model (CAPM) in order to derive the base discount rate. The inputs to
the CAPM include the 20-year risk-free rate, 5-year beta for a select peer set, and the market risk premium based
on published data. Once the output of the CAPM is determined, a size premium is added (also based on a
published source) as well as a company-specific risk premium, which is an estimate determined by the Company
and meant to compensate for the risk inherent in the future cash flow projections and inherent differences (such
as business model and market perception of risk) between Regions and the peer set. The table below summarizes
the discount rate used in the goodwill impairment tests of the Banking/Treasury reporting unit for the reporting
periods indicated:
4th Quarter
2011
3rd Quarter
2011
2nd Quarter
2011
1st Quarter
2011
4th Quarter
2010
Discount Rate ............................ 15% 15% 15% 15% 15%
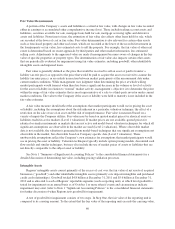
In estimating future cash flows, a balance sheet as of the test date and a statement of operations for the last
twelve months of activity for the reporting unit are compiled. From that point, future balance sheets and
statements of operations are projected based on the inputs discussed below. Cash flows are based on expected
future capitalization requirements due to balance sheet growth and anticipated changes in regulatory capital
requirements. The baseline cash flows utilized in all models correspond to the most recent internal forecasts and/
or budgets that range from 1 to 5 years. These internal forecasts are based on inputs developed in the Company’s
capital planning processes.
Refer to the discussion of intangible assets in Note 1 “Summary of Significant Accounting Policies” to the
consolidated financial statements for a discussion of these approaches and Note 9 “Intangible Assets” for a
discussion of the assumptions. The fair values of assets and liabilities are determined using an exit price concept.
Refer to the discussion of fair value in Note 1 “Summary of Significant Accounting Policies” to the consolidated
financial statements for discussions of the exit price concept and the determination of fair values of financial
assets and liabilities.
Throughout 2009 and 2010 in the Banking/Treasury reporting unit, the credit quality of Regions’ loan
portfolio declined, which contributed to increased losses as well as elevated non-performing loan levels.
Accordingly, Regions performed tests of goodwill for impairment during each quarter of 2010 and during the
second, third and fourth quarters of 2009 in a manner consistent with the test conducted in the fourth quarter of
2008. Regions continued to perform its goodwill impairment tests during the four quarters of 2011, in a manner
consistent with the tests conducted in prior periods, primarily due to the Company’s market capitalization
remaining below book value. The long-term fair value of equity was determined using both income and market
approaches (discussed in Note 9 “Intangible Assets”). The results of these calculations indicated that the fair
value of the Banking/Treasury reporting unit was less than the carrying amount. At October 1, 2011, the carrying
amount and fair value of the Banking/Treasury reporting unit were $12.0 billion and $7.6 billion, respectively,
while the carrying amount of goodwill for the reporting unit was $4.7 billion. Therefore, Step Two of the
goodwill impairment test was performed. In Step Two, the fair values of the reporting unit’s assets and liabilities,
including the loan portfolio, intangible assets, time deposits, debt, and other assets and liabilities were calculated.
Once the fair values were determined, deferred tax adjustments were calculated as applicable. For the Banking/
Treasury reporting unit, the after-tax effects of the Step Two adjustments, which were primarily write-downs of
61