Regions Bank 2011 Annual Report Download - page 173
Download and view the complete annual report
Please find page 173 of the 2011 Regions Bank annual report below. You can navigate through the pages in the report by either clicking on the pages listed below, or by using the keyword search tool below to find specific information within the annual report.-
 1
1 -
2
-
3
-
4
-
5
-
6
-
7
-
8
-
9
-
10
-
11
-
12
-
13
-
14
-
15
-
16
-
17
-
18
-
19
-
20
-
21
-
22
-
23
-
24
-
25
-
26
-
27
-
28
-
29
-
30
-
31
-
32
-
33
-
34
-
35
-
36
-
37
-
38
-
39
-
40
-
41
-
42
-
43
-
44
-
45
-
46
-
47
-
48
-
49
-
50
-
51
-
52
-
53
-
54
-
55
-
56
-
57
-
58
-
59
-
60
-
61
-
62
-
63
-
64
-
65
-
66
-
67
-
68
-
69
-
70
-
71
-
72
-
73
-
74
-
75
-
76
-
77
-
78
-
79
-
80
-
81
-
82
-
83
-
84
-
85
-
86
-
87
-
88
-
89
-
90
-
91
-
92
-
93
-
94
-
95
-
96
-
97
-
98
-
99
-
100
-
101
-
102
-
103
-
104
-
105
-
106
-
107
-
108
-
109
-
110
-
111
-
112
-
113
-
114
-
115
-
116
-
117
-
118
-
119
-
120
-
121
-
122
-
123
-
124
-
125
-
126
-
127
-
128
-
129
-
130
-
131
-
132
-
133
-
134
-
135
-
136
-
137
-
138
-
139
-
140
-
141
-
142
-
143
-
144
-
145
-
146
-
147
-
148
-
149
-
150
-
151
-
152
-
153
-
154
-
155
-
156
-
157
-
158
-
159
-
160
-
161
-
162
-
 163
163 -
 164
164 -
 165
165 -
 166
166 -
 167
167 -
 168
168 -
 169
169 -
 170
170 -
 171
171 -
 172
172 -
 173
173 -
 174
174 -
 175
175 -
 176
176 -
 177
177 -
 178
178 -
 179
179 -
 180
180 -
 181
181 -
 182
182 -
 183
183 -
184
-
185
-
186
-
187
-
188
-
189
-
190
-
191
-
192
-
193
-
194
-
195
-
196
-
197
-
198
-
199
-
200
-
201
-
202
-
203
-
204
-
205
-
206
-
207
-
208
-
209
-
210
-
211
-
212
-
213
-
214
-
215
-
216
-
217
-
218
-
219
-
220
-
221
-
222
-
223
-
224
-
225
-
226
-
227
-
228
-
229
-
230
-
231
-
232
-
233
-
234
-
235
-
236
-
237
-
238
-
239
-
240
-
241
-
242
-
243
-
244
-
245
-
246
-
247
-
248
-
249
-
250
-
251
-
252
-
253
-
254
-
255
-
256
-
257
-
258
-
259
-
260
-
261
-
262
-
263
-
264
-
265
-
266
-
267
-
268
 |
 |

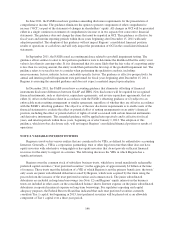
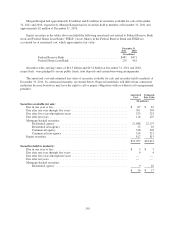
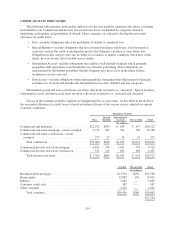
NOTE 4. SECURITIES
The amortized cost, gross unrealized gains and losses, and estimated fair value of securities available for
sale and securities held to maturity are as follows:
December 31, 2011
Amortized
Cost
Gross
Unrealized
Gains
Gross
Unrealized
Losses
Estimated
Fair
Value
(In millions)
Securities available for sale:
U.S. Treasury securities .............................. $ 95 $ 3 $— $ 98
Federal agency securities ............................. 147 — — 147
Obligations of states and political subdivisions ............ 24 12 — 36
Mortgage-backed securities:
Residential agency .............................. 21,688 494 (7) 22,175
Residential non-agency ........................... 15 1 — 16
Commercial agency .............................. 318 8 — 326
Commercial non-agency .......................... 314 7 — 321
Corporate and other debt securities ...................... 539 5 (7) 537
Equity securities .................................... 817 2 (4) 815
$23,957 $532 $ (18) $24,471
Securities held to maturity:
U.S. Treasury securities .............................. $ 4 $— $— $ 4
Federal agency securities ............................. 3 — — 3
Mortgage-backed securities:
Residential agency .............................. 9 1 — 10
$16 $1 $— $17
December 31, 2010
Amortized
Cost
Gross
Unrealized
Gains
Gross
Unrealized
Losses
Estimated
Fair
Value
(In millions)
Securities available for sale:
U.S. Treasury securities .............................. $ 85 $ 6 $— $ 91
Federal agency securities ............................. 16 — — 16
Obligations of states and political subdivisions ............ 23 7 — 30
Mortgage-backed securities:
Residential agency .............................. 21,735 265 (155) 21,845
Residential non-agency ........................... 20 2 — 22
Commercial agency .............................. 113 2 (3) 112
Commercial non-agency .......................... 103 — (3) 100
Other debt securities ................................. 27 — (2) 25
Equity securities .................................... 1,047 1 — 1,048
$23,169 $283 $(163) $23,289
Securities held to maturity:
U.S. Treasury securities .............................. $ 5 $ 1 $— $ 6
Federal agency securities ............................. 5 — — 5
Mortgage-backed securities: ...........................
Residential agency .............................. 12 1 — 13
Other debt securities ................................. 2 — — 2
$24 $2 $— $26
149