Regions Bank 2011 Annual Report Download - page 224
Download and view the complete annual report
Please find page 224 of the 2011 Regions Bank annual report below. You can navigate through the pages in the report by either clicking on the pages listed below, or by using the keyword search tool below to find specific information within the annual report.-
 1
1 -
2
-
3
-
4
-
5
-
6
-
7
-
8
-
9
-
10
-
11
-
12
-
13
-
14
-
15
-
16
-
17
-
18
-
19
-
20
-
21
-
22
-
23
-
24
-
25
-
26
-
27
-
28
-
29
-
30
-
31
-
32
-
33
-
34
-
35
-
36
-
37
-
38
-
39
-
40
-
41
-
42
-
43
-
44
-
45
-
46
-
47
-
48
-
49
-
50
-
51
-
52
-
53
-
54
-
55
-
56
-
57
-
58
-
59
-
60
-
61
-
62
-
63
-
64
-
65
-
66
-
67
-
68
-
69
-
70
-
71
-
72
-
73
-
74
-
75
-
76
-
77
-
78
-
79
-
80
-
81
-
82
-
83
-
84
-
85
-
86
-
87
-
88
-
89
-
90
-
91
-
92
-
93
-
94
-
95
-
96
-
97
-
98
-
99
-
100
-
101
-
102
-
103
-
104
-
105
-
106
-
107
-
108
-
109
-
110
-
111
-
112
-
113
-
114
-
115
-
116
-
117
-
118
-
119
-
120
-
121
-
122
-
123
-
124
-
125
-
126
-
127
-
128
-
129
-
130
-
131
-
132
-
133
-
134
-
135
-
136
-
137
-
138
-
139
-
140
-
141
-
142
-
143
-
144
-
145
-
146
-
147
-
148
-
149
-
150
-
151
-
152
-
153
-
154
-
155
-
156
-
157
-
158
-
159
-
160
-
161
-
162
-
163
-
164
-
165
-
166
-
167
-
168
-
169
-
170
-
171
-
172
-
173
-
174
-
175
-
176
-
177
-
178
-
179
-
180
-
181
-
182
-
183
-
184
-
185
-
186
-
187
-
188
-
189
-
190
-
191
-
192
-
193
-
194
-
195
-
196
-
197
-
198
-
199
-
200
-
201
-
202
-
203
-
204
-
205
-
206
-
207
-
208
-
209
-
210
-
211
-
212
-
213
-
 214
214 -
 215
215 -
 216
216 -
 217
217 -
 218
218 -
 219
219 -
 220
220 -
 221
221 -
 222
222 -
 223
223 -
 224
224 -
 225
225 -
 226
226 -
 227
227 -
 228
228 -
 229
229 -
 230
230 -
 231
231 -
 232
232 -
 233
233 -
 234
234 -
235
-
236
-
237
-
238
-
239
-
240
-
241
-
242
-
243
-
244
-
245
-
246
-
247
-
248
-
249
-
250
-
251
-
252
-
253
-
254
-
255
-
256
-
257
-
258
-
259
-
260
-
261
-
262
-
263
-
264
-
265
-
266
-
267
-
268
 |
 |

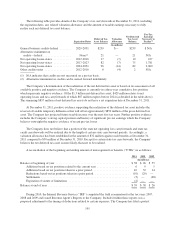
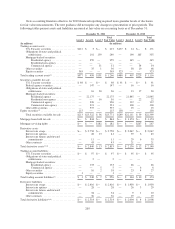
Regions enters into interest rate option contracts to protect cash flows through the maturity date of the hedging
instrument on designated one-month LIBOR floating-rate loans from adverse extreme market interest rate changes.
Regions purchases Eurodollar futures to hedge the variability in future cash flows based on forecasted resets of
one-month LIBOR-based floating rate loans due to changes in the benchmark interest rate. Regions recognized an
unrealized after-tax loss of $45 million and an unrealized after-tax gain of $37 million in accumulated other
comprehensive income at December 31, 2011 and 2010, respectively, related to terminated cash flow hedges of loan
and debt instruments which will be amortized into earnings in conjunction with the recognition of interest payments
through 2017. Regions recognized pre-tax income of $48 million and $41 million during the years ended
December 31, 2011 and 2010, respectively, related to the amortization of cash flow hedges of loan and debt
instruments.
Regions expects to reclassify out of other comprehensive income and into earnings approximately $47 million
in pre-tax income due to the receipt or payment of interest payments on all cash flow hedges within the next twelve
months. Included in this amount is $17 million in pre-tax net losses related to the amortization of discontinued cash
flow hedges. The maximum length of time over which Regions is hedging its exposure to the variability in future
cash flows for forecasted transactions is approximately six years as of December 31, 2011.
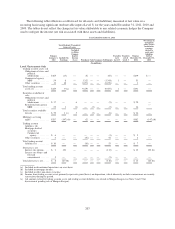
The following tables present the effect of derivative instruments on the statements of operations:
Year Ended December 31, 2011
Derivatives in Fair
Value Hedging
Relationships
Location of Gain(Loss)
Recognized in Income on
Derivatives
Amount of Gain(Loss)
Recognized in
Income on
Derivatives
Hedged Items in Fair
Value Hedge
Relationships
Location of Gain(Loss)
Recognized in Income on
Related Hedged Item
Amount of
Gain(Loss)
Recognized
in Income on
Related
Hedged Item
(In millions)
Interest rate swaps Other non-interest expense $ (74) Debt/CDs Other non- interest expense $ 89
Interest rate swaps Interest expense 173 Debt/CDs Interest expense 15
Forward commitments Other non-interest expense (46) Securities available
for sale
Other non-interest expense 46
Total $ 53 $150
Derivatives in Cash
Flow Hedging
Relationships
Amount of Gain(Loss)
Recognized in
Accumulated OCI on
Derivatives (Effective
Portion)(1)
Location of Gain(Loss)
Reclassified from
Accumulated OCI into
Income (Effective
Portion)
Amount of
Gain(Loss)
Reclassified from
Accumulated OCI
into Income (Effective
Portion)(2)
Location of Gain(Loss)
Recognized in Income on
Derivatives (Ineffective
Portion and Amount
Excluded from
Effectiveness Testing)
Amount of
Gain(Loss)
Recognized
in Income on
Derivatives
(Ineffective
Portion and
Amount
Excluded
from
Effectiveness
Testing) (2)
(In millions)
Interest rate swaps $ 92 Interest income on loans $183 Other non-interest expense $ 1
Forward starting swaps 2 Interest expense on debt (11) Other non-interest expense (1)
Interest rate options (2)Interest income on loans 4 Interest income on loans —
Eurodollar futures 1 Interest income on loans (2) Other non-interest expense —
Total $ 93 $174 $—
(1) After-tax
(2) Pre-tax
200