Regions Bank 2011 Annual Report Download - page 125
Download and view the complete annual report
Please find page 125 of the 2011 Regions Bank annual report below. You can navigate through the pages in the report by either clicking on the pages listed below, or by using the keyword search tool below to find specific information within the annual report.-
 1
1 -
2
-
3
-
4
-
5
-
6
-
7
-
8
-
9
-
10
-
11
-
12
-
13
-
14
-
15
-
16
-
17
-
18
-
19
-
20
-
21
-
22
-
23
-
24
-
25
-
26
-
27
-
28
-
29
-
30
-
31
-
32
-
33
-
34
-
35
-
36
-
37
-
38
-
39
-
40
-
41
-
42
-
43
-
44
-
45
-
46
-
47
-
48
-
49
-
50
-
51
-
52
-
53
-
54
-
55
-
56
-
57
-
58
-
59
-
60
-
61
-
62
-
63
-
64
-
65
-
66
-
67
-
68
-
69
-
70
-
71
-
72
-
73
-
74
-
75
-
76
-
77
-
78
-
79
-
80
-
81
-
82
-
83
-
84
-
85
-
86
-
87
-
88
-
89
-
90
-
91
-
92
-
93
-
94
-
95
-
96
-
97
-
98
-
99
-
100
-
101
-
102
-
103
-
104
-
105
-
106
-
107
-
108
-
109
-
110
-
111
-
112
-
113
-
114
-
 115
115 -
 116
116 -
 117
117 -
 118
118 -
 119
119 -
 120
120 -
 121
121 -
 122
122 -
 123
123 -
 124
124 -
 125
125 -
 126
126 -
 127
127 -
 128
128 -
 129
129 -
 130
130 -
 131
131 -
 132
132 -
 133
133 -
 134
134 -
 135
135 -
136
-
137
-
138
-
139
-
140
-
141
-
142
-
143
-
144
-
145
-
146
-
147
-
148
-
149
-
150
-
151
-
152
-
153
-
154
-
155
-
156
-
157
-
158
-
159
-
160
-
161
-
162
-
163
-
164
-
165
-
166
-
167
-
168
-
169
-
170
-
171
-
172
-
173
-
174
-
175
-
176
-
177
-
178
-
179
-
180
-
181
-
182
-
183
-
184
-
185
-
186
-
187
-
188
-
189
-
190
-
191
-
192
-
193
-
194
-
195
-
196
-
197
-
198
-
199
-
200
-
201
-
202
-
203
-
204
-
205
-
206
-
207
-
208
-
209
-
210
-
211
-
212
-
213
-
214
-
215
-
216
-
217
-
218
-
219
-
220
-
221
-
222
-
223
-
224
-
225
-
226
-
227
-
228
-
229
-
230
-
231
-
232
-
233
-
234
-
235
-
236
-
237
-
238
-
239
-
240
-
241
-
242
-
243
-
244
-
245
-
246
-
247
-
248
-
249
-
250
-
251
-
252
-
253
-
254
-
255
-
256
-
257
-
258
-
259
-
260
-
261
-
262
-
263
-
264
-
265
-
266
-
267
-
268
 |
 |

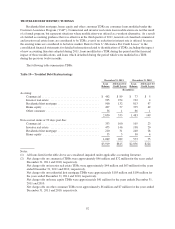
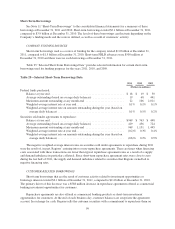
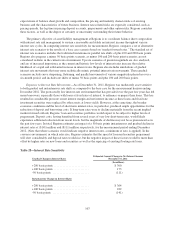
As of December 31, 2010
Standard
& Poor’s Moody’s Fitch DBRS
Regions Financial Corporation
Senior notes ........................................ BB+ Ba3 BBB- BBB
Subordinated notes .................................. BB B1 BB+ BBBL
Junior subordinated notes ............................. B B2 BB BBBL
Regions Bank
Short-term debt ..................................... A-3 NP
(1) F3 R-2H
Long-term bank deposits .............................. BBB- Ba1 BBB BBBH
Long-term debt ..................................... BBB- Ba2 BBB- BBBH
Subordinated debt ................................... BB+ Ba3 BB+ BBB
Outlook
December 31, 2010 .................................. Negative Negative Negative Negative
(1) Not Prime
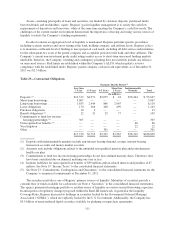
In general, ratings agencies base their ratings on many quantitative and qualitative factors, including capital
adequacy, liquidity, asset quality, business mix, probability of government support, and level and quality of
earnings. Any downgrade in credit ratings by one or more ratings agencies may impact Regions in several ways,
including, but not limited to, Regions’ access to the capital markets or short-term funding, borrowing cost and
capacity, collateral requirements, acceptability of its letters of credit, and funding of variable rate demand notes
(“VRDNs”), thereby potentially adversely impacting Regions’ financial condition and liquidity. See the “Risk
Factors” section of this Annual Report on Form 10-K for more information.
A security rating is not a recommendation to buy, sell or hold securities, and the ratings are subject to
revision or withdrawal at any time by the assigning rating agency. Each rating should be evaluated independently
of any other rating.
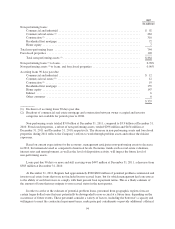
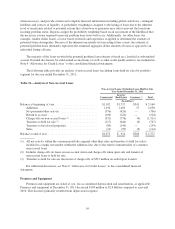
Stockholders’ Equity
Stockholders’ equity decreased to $16.5 billion at year-end 2011 versus $16.7 billion at year-end 2010. In
2011, net losses reduced stockholders’ equity by $215 million, cash dividends declared reduced stockholders’
equity by $51 million for common stock and $175 million for preferred stock, and changes in accumulated other
comprehensive income increased equity by $191 million.
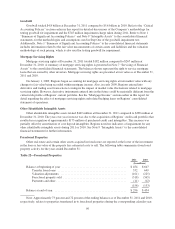
On May 7, 2009, the final results of the Federal Reserve’s Supervisory Capital Assessment Program
(“SCAP”) were released requiring Regions to submit a capital plan to its regulators detailing the steps to be
utilized to increase total Tier 1 common equity by $2.5 billion, of which at least $0.4 billion had to be new Tier 1
equity (see Table 2 “GAAP to Non-GAAP Reconciliation” and Table 27 “Capital Ratios” for further discussion).
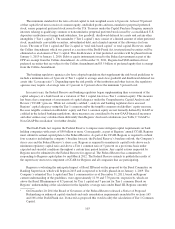
The Company’s public equity offering of common stock, announced May 20, 2009, resulted in the issuance
of 460 million shares at $4 per share, generating proceeds of approximately $1.8 billion, net of issuance costs.
The Company also issued 287,500 shares of mandatory convertible preferred stock, Series B (“Series B
shares”), generating net proceeds of approximately $278 million in 2009. Accrued dividends on the Series B
shares reduced retained earnings by $12 million and $19 million during 2010 and 2009, respectively. In
November 2009, a single investor converted approximately 20,000 Series B shares to common shares as allowed
under the original transaction documents. On June 18, 2010, as allowed by the terms of the Series B shares,
Regions initiated an early conversion of all of the remaining outstanding Series B shares. Dividends accrued and
101