Regions Bank 2011 Annual Report Download - page 243
Download and view the complete annual report
Please find page 243 of the 2011 Regions Bank annual report below. You can navigate through the pages in the report by either clicking on the pages listed below, or by using the keyword search tool below to find specific information within the annual report.-
 1
1 -
2
-
3
-
4
-
5
-
6
-
7
-
8
-
9
-
10
-
11
-
12
-
13
-
14
-
15
-
16
-
17
-
18
-
19
-
20
-
21
-
22
-
23
-
24
-
25
-
26
-
27
-
28
-
29
-
30
-
31
-
32
-
33
-
34
-
35
-
36
-
37
-
38
-
39
-
40
-
41
-
42
-
43
-
44
-
45
-
46
-
47
-
48
-
49
-
50
-
51
-
52
-
53
-
54
-
55
-
56
-
57
-
58
-
59
-
60
-
61
-
62
-
63
-
64
-
65
-
66
-
67
-
68
-
69
-
70
-
71
-
72
-
73
-
74
-
75
-
76
-
77
-
78
-
79
-
80
-
81
-
82
-
83
-
84
-
85
-
86
-
87
-
88
-
89
-
90
-
91
-
92
-
93
-
94
-
95
-
96
-
97
-
98
-
99
-
100
-
101
-
102
-
103
-
104
-
105
-
106
-
107
-
108
-
109
-
110
-
111
-
112
-
113
-
114
-
115
-
116
-
117
-
118
-
119
-
120
-
121
-
122
-
123
-
124
-
125
-
126
-
127
-
128
-
129
-
130
-
131
-
132
-
133
-
134
-
135
-
136
-
137
-
138
-
139
-
140
-
141
-
142
-
143
-
144
-
145
-
146
-
147
-
148
-
149
-
150
-
151
-
152
-
153
-
154
-
155
-
156
-
157
-
158
-
159
-
160
-
161
-
162
-
163
-
164
-
165
-
166
-
167
-
168
-
169
-
170
-
171
-
172
-
173
-
174
-
175
-
176
-
177
-
178
-
179
-
180
-
181
-
182
-
183
-
184
-
185
-
186
-
187
-
188
-
189
-
190
-
191
-
192
-
193
-
194
-
195
-
196
-
197
-
198
-
199
-
200
-
201
-
202
-
203
-
204
-
205
-
206
-
207
-
208
-
209
-
210
-
211
-
212
-
213
-
214
-
215
-
216
-
217
-
218
-
219
-
220
-
221
-
222
-
223
-
224
-
225
-
226
-
227
-
228
-
229
-
230
-
231
-
232
-
 233
233 -
 234
234 -
 235
235 -
 236
236 -
 237
237 -
 238
238 -
 239
239 -
 240
240 -
 241
241 -
 242
242 -
 243
243 -
 244
244 -
 245
245 -
 246
246 -
 247
247 -
 248
248 -
 249
249 -
 250
250 -
 251
251 -
 252
252 -
 253
253 -
254
-
255
-
256
-
257
-
258
-
259
-
260
-
261
-
262
-
263
-
264
-
265
-
266
-
267
-
268
 |
 |

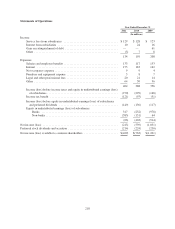
Statements of Cash Flows
Years Ended December 31
2011 2010 2009
(In millions)
Operating activities:
Net income (loss) ................................................. $ (215) $ (539) $(1,031)
Adjustments to reconcile net cash provided by operating activities:
Equity in undistributed earnings of subsidiaries ..................... 66 403 914
Depreciation, amortization and accretion, net ....................... 7 1 (2)
Loss on sale of premises and equipment ........................... 16 — —
Decrease (increase) in trading assets .............................. 6 (4) (3)
(Increase) decrease in other assets ................................ (26) 40 69
Increase (decrease) in other liabilities ............................. 79 (115) (80)
Other ...................................................... (9) 21 136
Net cash from operating activities ............................ (76) (193) 3
Investing activities:
Investment in subsidiaries .......................................... (110) (95) (2,681)
Principal payments on loans to subsidiaries ............................ 35 55 —
Net sales of premises and equipment ................................. 21 (1) 4
Proceeds from sales and maturities of securities available for sale .......... 34 13 23
Purchases of securities available for sale .............................. (28) (1) (1)
Net cash from investing activities ............................ (48) (29) (2,655)
Financing activities:
Proceeds from long-term borrowings ................................. — 743 690
Payments on long-term borrowings ................................... (1,001) (501) (493)
Net proceeds from issuance of mandatorily convertible preferred stock ...... — — 278
Net proceeds from issuance of common stock .......................... — — 1,769
Cash dividends on common stock .................................... (51) (49) (105)
Cash dividends on preferred stock ................................... (175) (184) (194)
Net cash from financing activities ............................ (1,227) 9 1,945
(Decrease) increase in cash and cash equivalents ........................ (1,351) (213) (707)
Cash and cash equivalents at beginning of year ............................. 3,848 4,061 4,768
Cash and cash equivalents at end of year .................................. $2,497 $3,848 $ 4,061
NOTE 25. SUBSEQUENT EVENT
On January 11, 2012, Regions entered into an agreement to sell 100% of the outstanding and issued
common stock of Morgan Keegan & Company, Inc. and related affiliates to Raymond James Financial Inc.
(“Raymond James”), for approximately $930 million in cash. The sale has been approved by the board of
directors of the Company and the board of directors of Raymond James. As part of the transaction, Morgan
Keegan will also pay Regions a dividend of $250 million before closing, pending regulatory approval, resulting
in total proceeds of $1.18 billion to Regions, subject to adjustment. The transaction is anticipated to close around
the end of the first quarter of 2012 subject to regulatory approvals and customary closing conditions. Morgan
Asset Management and Regions Morgan Keegan Trust are not included in the sale and will remain part of
Regions’ Wealth Management organization.
The transaction purchase price is subject to adjustment based on the closing tangible book value of the
entities being sold and retention of Morgan Keegan associates in the 90-day post-closing period. Regions
believes any adjustments to the sales price will not have a material impact to the consolidated financial
statements.
As part of the agreement, Regions will indemnify Raymond James for all litigation matters related to
pre-closing activities. At the time of the closing, Regions will record a liability equal to the fair value of the
indemnification liabilities which will be included in the calculation of gain/(loss) on disposition.
219