Regions Bank 2011 Annual Report Download - page 102
Download and view the complete annual report
Please find page 102 of the 2011 Regions Bank annual report below. You can navigate through the pages in the report by either clicking on the pages listed below, or by using the keyword search tool below to find specific information within the annual report.-
 1
1 -
2
-
3
-
4
-
5
-
6
-
7
-
8
-
9
-
10
-
11
-
12
-
13
-
14
-
15
-
16
-
17
-
18
-
19
-
20
-
21
-
22
-
23
-
24
-
25
-
26
-
27
-
28
-
29
-
30
-
31
-
32
-
33
-
34
-
35
-
36
-
37
-
38
-
39
-
40
-
41
-
42
-
43
-
44
-
45
-
46
-
47
-
48
-
49
-
50
-
51
-
52
-
53
-
54
-
55
-
56
-
57
-
58
-
59
-
60
-
61
-
62
-
63
-
64
-
65
-
66
-
67
-
68
-
69
-
70
-
71
-
72
-
73
-
74
-
75
-
76
-
77
-
78
-
79
-
80
-
81
-
82
-
83
-
84
-
85
-
86
-
87
-
88
-
89
-
90
-
91
-
 92
92 -
 93
93 -
 94
94 -
 95
95 -
 96
96 -
 97
97 -
 98
98 -
 99
99 -
 100
100 -
 101
101 -
 102
102 -
 103
103 -
 104
104 -
 105
105 -
 106
106 -
 107
107 -
 108
108 -
 109
109 -
 110
110 -
 111
111 -
 112
112 -
113
-
114
-
115
-
116
-
117
-
118
-
119
-
120
-
121
-
122
-
123
-
124
-
125
-
126
-
127
-
128
-
129
-
130
-
131
-
132
-
133
-
134
-
135
-
136
-
137
-
138
-
139
-
140
-
141
-
142
-
143
-
144
-
145
-
146
-
147
-
148
-
149
-
150
-
151
-
152
-
153
-
154
-
155
-
156
-
157
-
158
-
159
-
160
-
161
-
162
-
163
-
164
-
165
-
166
-
167
-
168
-
169
-
170
-
171
-
172
-
173
-
174
-
175
-
176
-
177
-
178
-
179
-
180
-
181
-
182
-
183
-
184
-
185
-
186
-
187
-
188
-
189
-
190
-
191
-
192
-
193
-
194
-
195
-
196
-
197
-
198
-
199
-
200
-
201
-
202
-
203
-
204
-
205
-
206
-
207
-
208
-
209
-
210
-
211
-
212
-
213
-
214
-
215
-
216
-
217
-
218
-
219
-
220
-
221
-
222
-
223
-
224
-
225
-
226
-
227
-
228
-
229
-
230
-
231
-
232
-
233
-
234
-
235
-
236
-
237
-
238
-
239
-
240
-
241
-
242
-
243
-
244
-
245
-
246
-
247
-
248
-
249
-
250
-
251
-
252
-
253
-
254
-
255
-
256
-
257
-
258
-
259
-
260
-
261
-
262
-
263
-
264
-
265
-
266
-
267
-
268
 |
 |

$6.9 billion at December 31, 2010. The year-over-year increase was primarily driven by an increase in cash and
due from banks slightly offset by a decrease in federal funds sold and securities purchased under agreements to
resell.
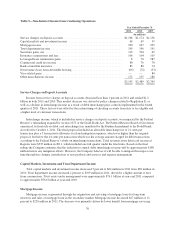
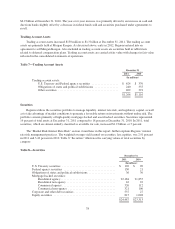
Trading Account Assets
Trading account assets increased $150 million to $1.3 billion at December 31, 2011. The trading account
assets are primarily held at Morgan Keegan. As discussed above, early in 2012, Regions entered into an
agreement to sell Morgan Keegan. Also included in trading account assets are securities held in rabbi trusts
related to deferred compensation plans. Trading account assets are carried at fair value with changes in fair value
reflected in the consolidated statements of operations.
Table 7—Trading Account Assets
December 31
2011 2010
(In millions)
Trading account assets:
U.S. Treasury and Federal agency securities .................. $ 624 $ 370
Obligations of states and political subdivisions ................ 240 355
Other securities ......................................... 402 391
$1,266 $1,116
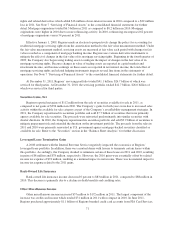
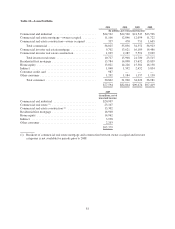
Securities
Regions utilizes the securities portfolio to manage liquidity, interest rate risk, and regulatory capital, as well
as to take advantage of market conditions to generate a favorable return on investments without undue risk. The
portfolio consists primarily of high-quality mortgage-backed and asset-backed securities. Securities represented
19 percent of total assets at December 31, 2011 compared to 18 percent at December 31, 2010. In 2011, total
securities, which are almost entirely classified as available for sale, increased $1.2 billion, or 5 percent.
The “Market Risk-Interest Rate Risk” section, found later in this report, further explains Regions’ interest
rate risk management practices. The weighted-average yield earned on securities, less equities, was 2.91 percent
in 2011 and 3.42 percent in 2010. Table 8 “Securities” illustrates the carrying values of total securities by
category.
Table 8—Securities
December 31
2011 2010
(In millions)
U.S. Treasury securities .................................... $ 102 $ 96
Federal agency securities ................................... 150 21
Obligations of states and political subdivisions .................. 36 30
Mortgage-backed securities:
Residential agency ..................................... 22,184 21,857
Residential non-agency ................................. 16 22
Commercial agency .................................... 326 112
Commercial non-agency ................................ 321 100
Corporate and other debt securities ............................ 537 27
Equity securities .......................................... 815 1,048
$24,487 $23,313
78