Regions Bank 2011 Annual Report Download - page 124
Download and view the complete annual report
Please find page 124 of the 2011 Regions Bank annual report below. You can navigate through the pages in the report by either clicking on the pages listed below, or by using the keyword search tool below to find specific information within the annual report.-
 1
1 -
2
-
3
-
4
-
5
-
6
-
7
-
8
-
9
-
10
-
11
-
12
-
13
-
14
-
15
-
16
-
17
-
18
-
19
-
20
-
21
-
22
-
23
-
24
-
25
-
26
-
27
-
28
-
29
-
30
-
31
-
32
-
33
-
34
-
35
-
36
-
37
-
38
-
39
-
40
-
41
-
42
-
43
-
44
-
45
-
46
-
47
-
48
-
49
-
50
-
51
-
52
-
53
-
54
-
55
-
56
-
57
-
58
-
59
-
60
-
61
-
62
-
63
-
64
-
65
-
66
-
67
-
68
-
69
-
70
-
71
-
72
-
73
-
74
-
75
-
76
-
77
-
78
-
79
-
80
-
81
-
82
-
83
-
84
-
85
-
86
-
87
-
88
-
89
-
90
-
91
-
92
-
93
-
94
-
95
-
96
-
97
-
98
-
99
-
100
-
101
-
102
-
103
-
104
-
105
-
106
-
107
-
108
-
109
-
110
-
111
-
112
-
113
-
 114
114 -
 115
115 -
 116
116 -
 117
117 -
 118
118 -
 119
119 -
 120
120 -
 121
121 -
 122
122 -
 123
123 -
 124
124 -
 125
125 -
 126
126 -
 127
127 -
 128
128 -
 129
129 -
 130
130 -
 131
131 -
 132
132 -
 133
133 -
 134
134 -
135
-
136
-
137
-
138
-
139
-
140
-
141
-
142
-
143
-
144
-
145
-
146
-
147
-
148
-
149
-
150
-
151
-
152
-
153
-
154
-
155
-
156
-
157
-
158
-
159
-
160
-
161
-
162
-
163
-
164
-
165
-
166
-
167
-
168
-
169
-
170
-
171
-
172
-
173
-
174
-
175
-
176
-
177
-
178
-
179
-
180
-
181
-
182
-
183
-
184
-
185
-
186
-
187
-
188
-
189
-
190
-
191
-
192
-
193
-
194
-
195
-
196
-
197
-
198
-
199
-
200
-
201
-
202
-
203
-
204
-
205
-
206
-
207
-
208
-
209
-
210
-
211
-
212
-
213
-
214
-
215
-
216
-
217
-
218
-
219
-
220
-
221
-
222
-
223
-
224
-
225
-
226
-
227
-
228
-
229
-
230
-
231
-
232
-
233
-
234
-
235
-
236
-
237
-
238
-
239
-
240
-
241
-
242
-
243
-
244
-
245
-
246
-
247
-
248
-
249
-
250
-
251
-
252
-
253
-
254
-
255
-
256
-
257
-
258
-
259
-
260
-
261
-
262
-
263
-
264
-
265
-
266
-
267
-
268
 |
 |

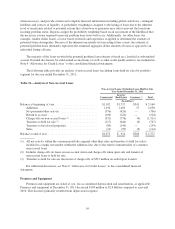
the following business day. The repurchase agreements are collateralized to allow for market fluctuations.
Securities from Regions Bank’s investment portfolio are used as collateral. From the customer’s perspective, the
investment earns more than a traditional money market instrument. From Regions’ standpoint, the repurchase
agreements are similar to deposit accounts, although they are not insured by the FDIC or guaranteed by the
United States or agencies. Regions Bank does not manage the level of these investments on a daily basis as the
transactions are initiated by the customers. The level of these borrowings can fluctuate significantly on a
day-to-day basis.
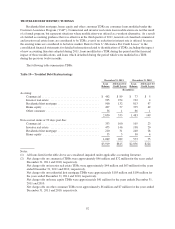
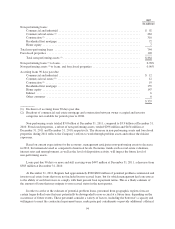
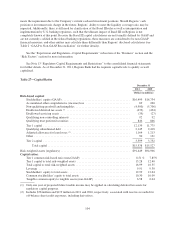
Long-Term Borrowings
Regions’ long-term borrowings consist primarily of FHLB borrowings, senior notes, subordinated notes and
other long-term notes payable. Total long-term borrowings decreased $5.1 billion to $8.1 billion at December 31,
2011. At the parent company, the decrease resulted from the maturity of approximately $1.0 billion of
subordinated notes. At the bank level, $2.0 billion of senior bank notes matured, which were originally issued
under the Temporary Liquidity Guarantee Program (“TLGP”). As of December 31, 2011, Regions had no
remaining borrowings under the TLGP. Also at the bank level, approximately $1.8 billion of FHLB advances and
$200 million of other long-term debt matured during 2011. The weighted-average interest rate on total long-term
debt, including the effect of derivative instruments, was 3.3%, 3.2% and 3.6% for the years ended December 31,
2011, 2010 and 2009, respectively. See Note 12 “Long-Term Borrowings” to the consolidated financial
statements for further discussion and detailed listing of outstandings and rates.
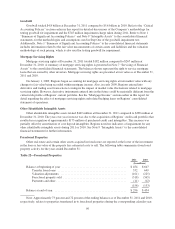
Ratings
During 2011, both Standard & Poor’s (“S&P”) and Fitch Ratings (“Fitch”) revised their outlook for Regions
and Regions Bank to stable from negative. Also during 2011, S&P upgraded Regions’ junior subordinated notes
to B+ from B.
As of December 31, 2011, S&P and Moody’s Investors Service (“Moody’s”) credit ratings for Regions
Financial Corporation were below investment grade. For Regions Bank, Moody’s credit ratings were below
investment grade. Also, Moody’s and Dominion Bond Rating Service (“DBRS”) continue to have negative
outlooks for Regions Financial Corporation and Regions Bank.
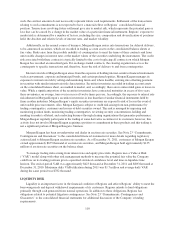
Table 26 “Credit Ratings” reflects the debt ratings information of Regions Financial Corporation and
Regions Bank by S&P, Moody’s, Fitch and DBRS as of December 31, 2011 and 2010.
Table 26—Credit Ratings
As of December 31, 2011
Standard
& Poor’s Moody’s Fitch DBRS
Regions Financial Corporation
Senior notes ......................................... BB+ Ba3 BBB- BBB
Subordinated notes ................................... BB B1 BB+ BBBL
Junior subordinated notes .............................. B+ B2 BB BBBL
Regions Bank
Short-term debt ...................................... A-3 NP(1) F3 R-2H
Long-term bank deposits ............................... BBB- Ba1 BBB BBBH
Long-term debt ...................................... BBB- Ba2 BBB- BBBH
Subordinated debt .................................... BB+ Ba3 BB+ BBB
Outlook
December 31, 2011 ................................... Stable Negative (2) Stable Negative
(1) Not Prime
(2) On February 14, 2012, Moody’s revised outlook to stable.
100