Regions Bank 2011 Annual Report Download - page 242
Download and view the complete annual report
Please find page 242 of the 2011 Regions Bank annual report below. You can navigate through the pages in the report by either clicking on the pages listed below, or by using the keyword search tool below to find specific information within the annual report.-
 1
1 -
2
-
3
-
4
-
5
-
6
-
7
-
8
-
9
-
10
-
11
-
12
-
13
-
14
-
15
-
16
-
17
-
18
-
19
-
20
-
21
-
22
-
23
-
24
-
25
-
26
-
27
-
28
-
29
-
30
-
31
-
32
-
33
-
34
-
35
-
36
-
37
-
38
-
39
-
40
-
41
-
42
-
43
-
44
-
45
-
46
-
47
-
48
-
49
-
50
-
51
-
52
-
53
-
54
-
55
-
56
-
57
-
58
-
59
-
60
-
61
-
62
-
63
-
64
-
65
-
66
-
67
-
68
-
69
-
70
-
71
-
72
-
73
-
74
-
75
-
76
-
77
-
78
-
79
-
80
-
81
-
82
-
83
-
84
-
85
-
86
-
87
-
88
-
89
-
90
-
91
-
92
-
93
-
94
-
95
-
96
-
97
-
98
-
99
-
100
-
101
-
102
-
103
-
104
-
105
-
106
-
107
-
108
-
109
-
110
-
111
-
112
-
113
-
114
-
115
-
116
-
117
-
118
-
119
-
120
-
121
-
122
-
123
-
124
-
125
-
126
-
127
-
128
-
129
-
130
-
131
-
132
-
133
-
134
-
135
-
136
-
137
-
138
-
139
-
140
-
141
-
142
-
143
-
144
-
145
-
146
-
147
-
148
-
149
-
150
-
151
-
152
-
153
-
154
-
155
-
156
-
157
-
158
-
159
-
160
-
161
-
162
-
163
-
164
-
165
-
166
-
167
-
168
-
169
-
170
-
171
-
172
-
173
-
174
-
175
-
176
-
177
-
178
-
179
-
180
-
181
-
182
-
183
-
184
-
185
-
186
-
187
-
188
-
189
-
190
-
191
-
192
-
193
-
194
-
195
-
196
-
197
-
198
-
199
-
200
-
201
-
202
-
203
-
204
-
205
-
206
-
207
-
208
-
209
-
210
-
211
-
212
-
213
-
214
-
215
-
216
-
217
-
218
-
219
-
220
-
221
-
222
-
223
-
224
-
225
-
226
-
227
-
228
-
229
-
230
-
231
-
 232
232 -
 233
233 -
 234
234 -
 235
235 -
 236
236 -
 237
237 -
 238
238 -
 239
239 -
 240
240 -
 241
241 -
 242
242 -
 243
243 -
 244
244 -
 245
245 -
 246
246 -
 247
247 -
 248
248 -
 249
249 -
 250
250 -
 251
251 -
 252
252 -
253
-
254
-
255
-
256
-
257
-
258
-
259
-
260
-
261
-
262
-
263
-
264
-
265
-
266
-
267
-
268
 |
 |

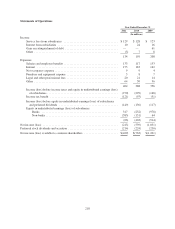
Statements of Operations
Year Ended December 31
2011 2010 2009
(In millions)
Income:
Service fees from subsidiaries ..................................... $129 $128 $ 123
Interest from subsidiaries ......................................... 10 24 16
Gain on extinguishment of debt .................................... — — 61
Other ......................................................... (5) 7 8
134 159 208
Expenses:
Salaries and employee benefits ..................................... 133 117 133
Interest ....................................................... 173 183 162
Net occupancy expense ........................................... 9 9 4
Furniture and equipment expense ................................... 5 8 7
Legal and other professional fees ................................... 20 21 14
Other ......................................................... 64 50 36
404 388 356
Income (loss) before income taxes and equity in undistributed earnings (loss)
of subsidiaries ................................................ (270) (229) (148)
Income tax benefit .............................................. (121) (93) (31)
Income (loss) before equity in undistributed earnings (loss) of subsidiaries
and preferred dividends ........................................ (149) (136) (117)
Equity in undistributed earnings (loss) of subsidiaries:
Banks .................................................... 317 (252) (978)
Non-banks ................................................. (383) (151) 64
(66) (403) (914)
Net income (loss) ................................................... (215) (539) (1,031)
Preferred stock dividends and accretion .................................. (214) (224) (230)
Net income (loss) available to common shareholders ....................... $(429) $(763) $(1,261)
218