Regions Bank 2011 Annual Report Download - page 230
Download and view the complete annual report
Please find page 230 of the 2011 Regions Bank annual report below. You can navigate through the pages in the report by either clicking on the pages listed below, or by using the keyword search tool below to find specific information within the annual report.-
 1
1 -
2
-
3
-
4
-
5
-
6
-
7
-
8
-
9
-
10
-
11
-
12
-
13
-
14
-
15
-
16
-
17
-
18
-
19
-
20
-
21
-
22
-
23
-
24
-
25
-
26
-
27
-
28
-
29
-
30
-
31
-
32
-
33
-
34
-
35
-
36
-
37
-
38
-
39
-
40
-
41
-
42
-
43
-
44
-
45
-
46
-
47
-
48
-
49
-
50
-
51
-
52
-
53
-
54
-
55
-
56
-
57
-
58
-
59
-
60
-
61
-
62
-
63
-
64
-
65
-
66
-
67
-
68
-
69
-
70
-
71
-
72
-
73
-
74
-
75
-
76
-
77
-
78
-
79
-
80
-
81
-
82
-
83
-
84
-
85
-
86
-
87
-
88
-
89
-
90
-
91
-
92
-
93
-
94
-
95
-
96
-
97
-
98
-
99
-
100
-
101
-
102
-
103
-
104
-
105
-
106
-
107
-
108
-
109
-
110
-
111
-
112
-
113
-
114
-
115
-
116
-
117
-
118
-
119
-
120
-
121
-
122
-
123
-
124
-
125
-
126
-
127
-
128
-
129
-
130
-
131
-
132
-
133
-
134
-
135
-
136
-
137
-
138
-
139
-
140
-
141
-
142
-
143
-
144
-
145
-
146
-
147
-
148
-
149
-
150
-
151
-
152
-
153
-
154
-
155
-
156
-
157
-
158
-
159
-
160
-
161
-
162
-
163
-
164
-
165
-
166
-
167
-
168
-
169
-
170
-
171
-
172
-
173
-
174
-
175
-
176
-
177
-
178
-
179
-
180
-
181
-
182
-
183
-
184
-
185
-
186
-
187
-
188
-
189
-
190
-
191
-
192
-
193
-
194
-
195
-
196
-
197
-
198
-
199
-
200
-
201
-
202
-
203
-
204
-
205
-
206
-
207
-
208
-
209
-
210
-
211
-
212
-
213
-
214
-
215
-
216
-
217
-
218
-
219
-
 220
220 -
 221
221 -
 222
222 -
 223
223 -
 224
224 -
 225
225 -
 226
226 -
 227
227 -
 228
228 -
 229
229 -
 230
230 -
 231
231 -
 232
232 -
 233
233 -
 234
234 -
 235
235 -
 236
236 -
 237
237 -
 238
238 -
 239
239 -
 240
240 -
241
-
242
-
243
-
244
-
245
-
246
-
247
-
248
-
249
-
250
-
251
-
252
-
253
-
254
-
255
-
256
-
257
-
258
-
259
-
260
-
261
-
262
-
263
-
264
-
265
-
266
-
267
-
268
 |
 |

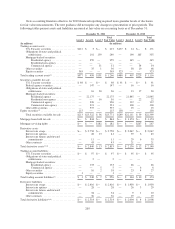
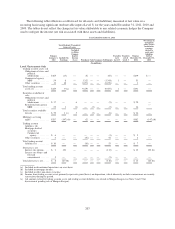
(1) All trading account assets are related to Morgan Keegan (see Note 25 for further discussion regarding the
pending sale of Morgan Keegan) with the exception of $178 million and $141 million of equity securities at
December 31, 2011 and 2010, respectively, of which all are classified as Level 1 in the table.
(2) Excludes Federal Reserve Bank and Federal Home Loan Bank Stock totaling $481 million and $219
million, respectively, at December 31, 2011 and $471 million and $419 million, respectively, at
December 31, 2010.
(3) At December 31, 2011, derivatives include approximately $1.4 billion related to legally enforceable master
netting agreements that allow the Company to settle positive and negative positions. Derivatives are also
presented excluding cash collateral received of $55 million and cash collateral posted of $732 million with
counterparties. At December 31, 2010, derivatives include approximately $1.0 billion related to legally
enforceable master netting agreements that allow the Company to settle positive and negative positions.
Derivatives are also presented excluding cash collateral received of $11 million and cash collateral posted of
$810 million with counterparties.
(4) Derivative assets and liabilities both include $454 million of interest rate swaps and $23 million of interest
rate options at December 31, 2011 and $269 million of interest rate swaps and $21 million of interest rate
options at December 31, 2010 related to Morgan Keegan, all of which are classified as Level 2 in the table.
(5) All trading account liabilities are related to Morgan Keegan at December 31, 2011 and 2010.
Assets and liabilities in all levels could result in volatile and material price fluctuations. Realized and
unrealized gains and losses on Level 3 assets represent only a portion of the risk to market fluctuations in
Regions’ consolidated balance sheets. Further, trading account assets, trading account liabilities, and derivatives
included in Levels 1, 2 and 3 are used by the Asset and Liability Management Committee of the Company in a
holistic approach to managing price fluctuation risks.
206