Regions Bank 2011 Annual Report Download - page 145
Download and view the complete annual report
Please find page 145 of the 2011 Regions Bank annual report below. You can navigate through the pages in the report by either clicking on the pages listed below, or by using the keyword search tool below to find specific information within the annual report.-
 1
1 -
2
-
3
-
4
-
5
-
6
-
7
-
8
-
9
-
10
-
11
-
12
-
13
-
14
-
15
-
16
-
17
-
18
-
19
-
20
-
21
-
22
-
23
-
24
-
25
-
26
-
27
-
28
-
29
-
30
-
31
-
32
-
33
-
34
-
35
-
36
-
37
-
38
-
39
-
40
-
41
-
42
-
43
-
44
-
45
-
46
-
47
-
48
-
49
-
50
-
51
-
52
-
53
-
54
-
55
-
56
-
57
-
58
-
59
-
60
-
61
-
62
-
63
-
64
-
65
-
66
-
67
-
68
-
69
-
70
-
71
-
72
-
73
-
74
-
75
-
76
-
77
-
78
-
79
-
80
-
81
-
82
-
83
-
84
-
85
-
86
-
87
-
88
-
89
-
90
-
91
-
92
-
93
-
94
-
95
-
96
-
97
-
98
-
99
-
100
-
101
-
102
-
103
-
104
-
105
-
106
-
107
-
108
-
109
-
110
-
111
-
112
-
113
-
114
-
115
-
116
-
117
-
118
-
119
-
120
-
121
-
122
-
123
-
124
-
125
-
126
-
127
-
128
-
129
-
130
-
131
-
132
-
133
-
134
-
 135
135 -
 136
136 -
 137
137 -
 138
138 -
 139
139 -
 140
140 -
 141
141 -
 142
142 -
 143
143 -
 144
144 -
 145
145 -
 146
146 -
 147
147 -
 148
148 -
 149
149 -
 150
150 -
 151
151 -
 152
152 -
 153
153 -
 154
154 -
 155
155 -
156
-
157
-
158
-
159
-
160
-
161
-
162
-
163
-
164
-
165
-
166
-
167
-
168
-
169
-
170
-
171
-
172
-
173
-
174
-
175
-
176
-
177
-
178
-
179
-
180
-
181
-
182
-
183
-
184
-
185
-
186
-
187
-
188
-
189
-
190
-
191
-
192
-
193
-
194
-
195
-
196
-
197
-
198
-
199
-
200
-
201
-
202
-
203
-
204
-
205
-
206
-
207
-
208
-
209
-
210
-
211
-
212
-
213
-
214
-
215
-
216
-
217
-
218
-
219
-
220
-
221
-
222
-
223
-
224
-
225
-
226
-
227
-
228
-
229
-
230
-
231
-
232
-
233
-
234
-
235
-
236
-
237
-
238
-
239
-
240
-
241
-
242
-
243
-
244
-
245
-
246
-
247
-
248
-
249
-
250
-
251
-
252
-
253
-
254
-
255
-
256
-
257
-
258
-
259
-
260
-
261
-
262
-
263
-
264
-
265
-
266
-
267
-
268
 |
 |

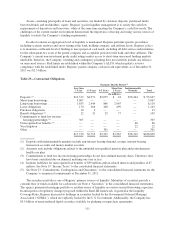
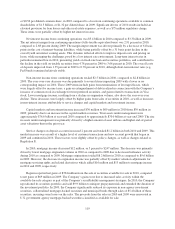
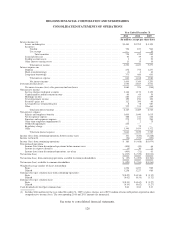
At December 31, 2010, the allowance for loan losses totaled $3.2 billion or 3.84 percent of total loans, net
of unearned income compared to $3.1 billion or 3.43 percent at year-end 2009. The increase in the allowance for
loan loss ratio reflected management’s estimate of the level of inherent losses in the portfolio, which stabilized
during 2010, as well as a result of the decline in the loan portfolio balance.
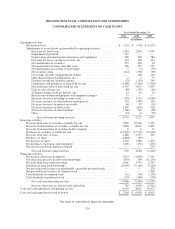
Table 30—Quarterly Results of Operations
2011 2010
Fourth
Quarter (3)
Third
Quarter
Second
Quarter
First
Quarter
Fourth
Quarter
Third
Quarter
Second
Quarter
First
Quarter
(In millions, except per share data)
Total interest income ....................... $1,031 $1,055 $1,076 $1,090 $1,120 $1,147 $1,167 $1,203
Total interest expense ....................... 182 205 220 235 257 288 321 382
Net interest income ......................... 849 850 856 855 863 859 846 821
Provision for loan losses ..................... 295 355 398 482 682 760 651 770
Net interest income after provision
for loan losses ......................... 554 495 458 373 181 99 195 51
Total non-interest income, excluding securities
gains (losses), net 500 514 519 498 587 488 516 504
Securities gains (losses), net .................. 7 (1) 24 82 333 2 — 59
Total non-interest expense ................... 1,124 850 956 932 990 910 966 993
Income (loss) from continuing operations before
income taxes ............................ (63) 158 45 21 111 (321) (255) (379)
Income tax expense (benefit) ................. 18 17 (34) (29) 44 (157) (95) (168)
Income (loss) from continuing operations ....... (81) 141 79 50 67 (164) (160) (211)
Discontinued operations
Income (loss) from discontinued operations
before income taxes .................. (472) 24 4 36 31 16 (110) 22
Income tax expense (benefit) ............. (5) 10 (26) 179777
Income (loss) from discontinued operations,
netoftax ........................... (467) 14 30 19 22 9 (117) 15
Net income (loss) .......................... $ (548) $ 155 $ 109 $ 69 $ 89 $ (155) $ (277) $ (196)
Income (loss) from continuing operations available
to common shareholders ................. $ (135) $ 87 $ 25 $ (2) $ 14 $ (218) $ (218) $ (270)
Net income (loss) available to common
shareholders ............................ $ (602) $ 101 $ 55 $ 17 $ 36 $ (209) $ (335) $ (255)
Earnings (loss) per common share from continuing
operations: (1)
Basic ................................ $(0.11) $ 0.07 $ 0.02 $ (0.00) $ 0.01 $ (0.17) $ (0.18) $ (0.23)
Diluted .............................. (0.11) 0.07 0.02 (0.00) 0.01 (0.17) (0.18) (0.23)
Earnings (loss) per common share: (1)
Basic ................................ $(0.48) $ 0.08 $ 0.04 $ 0.01 $ 0.03 $ (0.17) $ (0.28) $ (0.21)
Diluted .............................. (0.48) 0.08 0.04 0.01 0.03 (0.17) (0.28) (0.21)
Cash dividends declared per share ............. 0.01 0.01 0.01 0.01 0.01 0.01 0.01 0.01
Market price: (2)
High ................................ 4.46 6.53 7.45 8.09 7.62 7.76 9.33 8.05
Low ................................. 2.82 3.33 5.86 6.79 5.12 6.12 6.55 5.33
(1) Quarterly amounts may not add to year-to-date amounts due to rounding.
(2) High and low market prices are based on intraday sales prices.
(3) Includes goodwill impairment of $253 million in non-interest expense from continuing operations. Discontinued
operations includes goodwill impairment of $478 million, net of a $14 million income tax benefit.
121