Regions Bank 2011 Annual Report Download - page 212
Download and view the complete annual report
Please find page 212 of the 2011 Regions Bank annual report below. You can navigate through the pages in the report by either clicking on the pages listed below, or by using the keyword search tool below to find specific information within the annual report.-
 1
1 -
2
-
3
-
4
-
5
-
6
-
7
-
8
-
9
-
10
-
11
-
12
-
13
-
14
-
15
-
16
-
17
-
18
-
19
-
20
-
21
-
22
-
23
-
24
-
25
-
26
-
27
-
28
-
29
-
30
-
31
-
32
-
33
-
34
-
35
-
36
-
37
-
38
-
39
-
40
-
41
-
42
-
43
-
44
-
45
-
46
-
47
-
48
-
49
-
50
-
51
-
52
-
53
-
54
-
55
-
56
-
57
-
58
-
59
-
60
-
61
-
62
-
63
-
64
-
65
-
66
-
67
-
68
-
69
-
70
-
71
-
72
-
73
-
74
-
75
-
76
-
77
-
78
-
79
-
80
-
81
-
82
-
83
-
84
-
85
-
86
-
87
-
88
-
89
-
90
-
91
-
92
-
93
-
94
-
95
-
96
-
97
-
98
-
99
-
100
-
101
-
102
-
103
-
104
-
105
-
106
-
107
-
108
-
109
-
110
-
111
-
112
-
113
-
114
-
115
-
116
-
117
-
118
-
119
-
120
-
121
-
122
-
123
-
124
-
125
-
126
-
127
-
128
-
129
-
130
-
131
-
132
-
133
-
134
-
135
-
136
-
137
-
138
-
139
-
140
-
141
-
142
-
143
-
144
-
145
-
146
-
147
-
148
-
149
-
150
-
151
-
152
-
153
-
154
-
155
-
156
-
157
-
158
-
159
-
160
-
161
-
162
-
163
-
164
-
165
-
166
-
167
-
168
-
169
-
170
-
171
-
172
-
173
-
174
-
175
-
176
-
177
-
178
-
179
-
180
-
181
-
182
-
183
-
184
-
185
-
186
-
187
-
188
-
189
-
190
-
191
-
192
-
193
-
194
-
195
-
196
-
197
-
198
-
199
-
200
-
201
-
 202
202 -
 203
203 -
 204
204 -
 205
205 -
 206
206 -
 207
207 -
 208
208 -
 209
209 -
 210
210 -
 211
211 -
 212
212 -
 213
213 -
 214
214 -
 215
215 -
 216
216 -
 217
217 -
 218
218 -
 219
219 -
 220
220 -
 221
221 -
 222
222 -
223
-
224
-
225
-
226
-
227
-
228
-
229
-
230
-
231
-
232
-
233
-
234
-
235
-
236
-
237
-
238
-
239
-
240
-
241
-
242
-
243
-
244
-
245
-
246
-
247
-
248
-
249
-
250
-
251
-
252
-
253
-
254
-
255
-
256
-
257
-
258
-
259
-
260
-
261
-
262
-
263
-
264
-
265
-
266
-
267
-
268
 |
 |

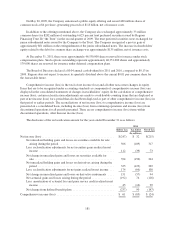
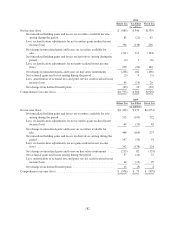
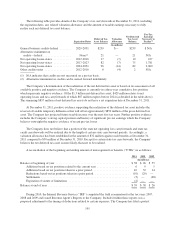
Net periodic benefit cost included the following components for the years ended December 31:
Pension
Other
Postretirement Benefits
2011 2010 2009 2011 2010 2009
(In millions)
Service cost ......................................... $ 36 $ 36 $ 3 $— $— $—
Interest cost ......................................... 91 93 90 1 1 2
Expected return on plan assets .......................... (121) (107) (88) — — —
Amortization of actuarial loss ........................... 45 44 50 — — —
Amortization of prior service cost (credit) ................. 1 1 1 (1) (1) (1)
Settlement charge .................................... — 3 1 — — —
Net periodic benefit cost ............................... $ 52 $ 70 $57 $— $— $ 1
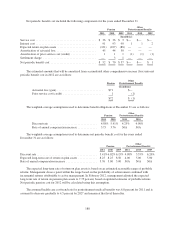
The estimated amounts that will be amortized from accumulated other comprehensive income (loss) into net
periodic benefit cost in 2012 are as follows:
Pension
Other
Postretirement Benefits
(In millions)
Actuarial loss (gain) ............................... $71 $—
Prior service cost (credit) ........................... 1 (1)
$72 $ (1)
The weighted-average assumptions used to determine benefit obligations at December 31 are as follows:
Pension
Other
Postretirement Benefits
2011 2010 2011 2010
Discount rate ................................ 4.58% 5.41% 4.25% 4.90%
Rate of annual compensation increase ............. 3.75 3.76 N/A N/A
The weighted-average assumptions used to determine net periodic benefit cost for the years ended
December 31 are as follows:
Pension
Other
Postretirement Benefits
2011 2010 2009 2011 2010 2009
Discount rate ......................................... 5.41% 6.02% 6.15% 4.90% 5.35% 6.20%
Expected long-term rate of return on plan assets ............. 8.25 8.25 8.50 4.00 5.00 5.00
Rate of annual compensation increase ..................... 3.76 5.00 5.00 N/A N/A N/A
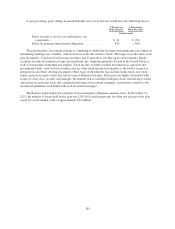
The expected long-term rate of return on plan assets is based on an estimated reasonable range of probable
returns. Management chose a point within the range based on the probability of achievement combined with
incremental returns attributable to active management. In February 2012, management adjusted the expected
long-term rate of return on pension plan assets to 7.75 percent, based on updated estimates of probable returns.
Net periodic pension cost for 2012 will be calculated using this assumption.
The assumed health care cost trend rate for postretirement medical benefits was 6.8 percent for 2011 and is
assumed to decrease gradually to 4.5 percent by 2027 and remain at that level thereafter.
188