Regions Bank 2011 Annual Report Download - page 188
Download and view the complete annual report
Please find page 188 of the 2011 Regions Bank annual report below. You can navigate through the pages in the report by either clicking on the pages listed below, or by using the keyword search tool below to find specific information within the annual report.-
 1
1 -
2
-
3
-
4
-
5
-
6
-
7
-
8
-
9
-
10
-
11
-
12
-
13
-
14
-
15
-
16
-
17
-
18
-
19
-
20
-
21
-
22
-
23
-
24
-
25
-
26
-
27
-
28
-
29
-
30
-
31
-
32
-
33
-
34
-
35
-
36
-
37
-
38
-
39
-
40
-
41
-
42
-
43
-
44
-
45
-
46
-
47
-
48
-
49
-
50
-
51
-
52
-
53
-
54
-
55
-
56
-
57
-
58
-
59
-
60
-
61
-
62
-
63
-
64
-
65
-
66
-
67
-
68
-
69
-
70
-
71
-
72
-
73
-
74
-
75
-
76
-
77
-
78
-
79
-
80
-
81
-
82
-
83
-
84
-
85
-
86
-
87
-
88
-
89
-
90
-
91
-
92
-
93
-
94
-
95
-
96
-
97
-
98
-
99
-
100
-
101
-
102
-
103
-
104
-
105
-
106
-
107
-
108
-
109
-
110
-
111
-
112
-
113
-
114
-
115
-
116
-
117
-
118
-
119
-
120
-
121
-
122
-
123
-
124
-
125
-
126
-
127
-
128
-
129
-
130
-
131
-
132
-
133
-
134
-
135
-
136
-
137
-
138
-
139
-
140
-
141
-
142
-
143
-
144
-
145
-
146
-
147
-
148
-
149
-
150
-
151
-
152
-
153
-
154
-
155
-
156
-
157
-
158
-
159
-
160
-
161
-
162
-
163
-
164
-
165
-
166
-
167
-
168
-
169
-
170
-
171
-
172
-
173
-
174
-
175
-
176
-
177
-
 178
178 -
 179
179 -
 180
180 -
 181
181 -
 182
182 -
 183
183 -
 184
184 -
 185
185 -
 186
186 -
 187
187 -
 188
188 -
 189
189 -
 190
190 -
 191
191 -
 192
192 -
 193
193 -
 194
194 -
 195
195 -
 196
196 -
 197
197 -
 198
198 -
199
-
200
-
201
-
202
-
203
-
204
-
205
-
206
-
207
-
208
-
209
-
210
-
211
-
212
-
213
-
214
-
215
-
216
-
217
-
218
-
219
-
220
-
221
-
222
-
223
-
224
-
225
-
226
-
227
-
228
-
229
-
230
-
231
-
232
-
233
-
234
-
235
-
236
-
237
-
238
-
239
-
240
-
241
-
242
-
243
-
244
-
245
-
246
-
247
-
248
-
249
-
250
-
251
-
252
-
253
-
254
-
255
-
256
-
257
-
258
-
259
-
260
-
261
-
262
-
263
-
264
-
265
-
266
-
267
-
268
 |
 |

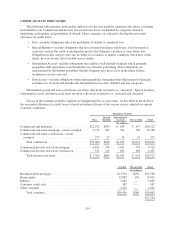
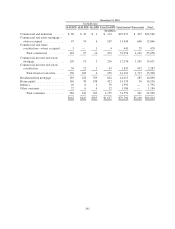
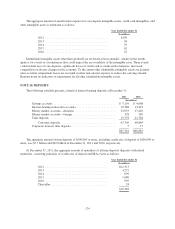
Total Impaired Loans As of December 31, 2010
Unpaid
Principal
Balance(1)
Charge-
offs and
Payments
Applied(2)
Book
Value(3)
Related
Allowance
for Loan
Losses Coverage %(4)
(Dollars in millions)
Commercial and industrial ..................... $ 545 $124 $ 421 $102 41.5%
Commercial real estate mortgage—owner
occupied .................................. 746 96 650 167 35.3
Commercial real estate construction—owner
occupied .................................. 47 16 31 10 55.3
Total commercial ......................... 1,338 236 1,102 279 38.5
Commercial investor real estate mortgage ......... 1,693 273 1,420 319 35.0
Commercial investor real estate construction ....... 638 150 488 154 47.6
Total investor real estate ................... 2,331 423 1,908 473 38.4
Residential first mortgage ...................... 1,113 60 1,053 126 16.7
Home equity ................................ 378 13 365 46 15.6
Indirect ..................................... 2 — 2 — —
Other consumer .............................. 65 — 65 1 1.5
Total consumer .......................... 1,558 73 1,485 173 15.8
Total impaired loans .......................... $5,227 $732 $4,495 $925 31.7%
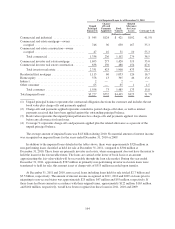
(1) Unpaid principal balance represents the contractual obligation due from the customer and includes the net
book value plus charge-offs and payments applied.
(2) Charge-offs and payments applied represents cumulative partial charge-offs taken, as well as interest
payments received that have been applied against the outstanding principal balance.
(3) Book value represents the unpaid principal balance less charge-offs and payments applied; it is shown
before any allowance for loan losses.
(4) Coverage % represents charge-offs and payments applied plus the related allowance as a percent of the
unpaid principal balance.
The average amount of impaired loans was $4.8 billion during 2010. No material amount of interest income
was recognized on impaired loans for the years ended December 31, 2010 or 2009.
In addition to the impaired loans detailed in the tables above, there were approximately $328 million in
non-performing loans classified as held for sale at December 31, 2011, compared to $304 million at
December 31, 2010. These loans are primarily investor real estate, where management does not have the intent to
hold the loans for the foreseeable future. The loans are carried at the lower of book basis or an amount
approximating the fair value which will be recoverable through the loan sale market. During the year ended
December 31, 2011, approximately $767 million in primarily non-performing investor real estate loans were
transferred to held for sale; this amount is net of charge-offs of $513 million recorded upon transfer.
At December 31, 2011 and 2010, non-accrual loans including loans held for sale totaled $2.7 billion and
$3.5 billion, respectively. The amount of interest income recognized in 2011, 2010 and 2009 on loans prior to
migrating to non-accrual status was approximately $23 million, $47 million and $55 million, respectively. If
these loans had been current in accordance with their original terms, approximately $122 million, $165 million
and $160 million, respectively, would have been recognized on these loans in 2011, 2010 and 2009.
164