Regions Bank 2011 Annual Report Download - page 80
Download and view the complete annual report
Please find page 80 of the 2011 Regions Bank annual report below. You can navigate through the pages in the report by either clicking on the pages listed below, or by using the keyword search tool below to find specific information within the annual report.-
 1
1 -
2
-
3
-
4
-
5
-
6
-
7
-
8
-
9
-
10
-
11
-
12
-
13
-
14
-
15
-
16
-
17
-
18
-
19
-
20
-
21
-
22
-
23
-
24
-
25
-
26
-
27
-
28
-
29
-
30
-
31
-
32
-
33
-
34
-
35
-
36
-
37
-
38
-
39
-
40
-
41
-
42
-
43
-
44
-
45
-
46
-
47
-
48
-
49
-
50
-
51
-
52
-
53
-
54
-
55
-
56
-
57
-
58
-
59
-
60
-
61
-
62
-
63
-
64
-
65
-
66
-
67
-
68
-
69
-
 70
70 -
 71
71 -
 72
72 -
 73
73 -
 74
74 -
 75
75 -
 76
76 -
 77
77 -
 78
78 -
 79
79 -
 80
80 -
 81
81 -
 82
82 -
 83
83 -
 84
84 -
 85
85 -
 86
86 -
 87
87 -
 88
88 -
 89
89 -
 90
90 -
91
-
92
-
93
-
94
-
95
-
96
-
97
-
98
-
99
-
100
-
101
-
102
-
103
-
104
-
105
-
106
-
107
-
108
-
109
-
110
-
111
-
112
-
113
-
114
-
115
-
116
-
117
-
118
-
119
-
120
-
121
-
122
-
123
-
124
-
125
-
126
-
127
-
128
-
129
-
130
-
131
-
132
-
133
-
134
-
135
-
136
-
137
-
138
-
139
-
140
-
141
-
142
-
143
-
144
-
145
-
146
-
147
-
148
-
149
-
150
-
151
-
152
-
153
-
154
-
155
-
156
-
157
-
158
-
159
-
160
-
161
-
162
-
163
-
164
-
165
-
166
-
167
-
168
-
169
-
170
-
171
-
172
-
173
-
174
-
175
-
176
-
177
-
178
-
179
-
180
-
181
-
182
-
183
-
184
-
185
-
186
-
187
-
188
-
189
-
190
-
191
-
192
-
193
-
194
-
195
-
196
-
197
-
198
-
199
-
200
-
201
-
202
-
203
-
204
-
205
-
206
-
207
-
208
-
209
-
210
-
211
-
212
-
213
-
214
-
215
-
216
-
217
-
218
-
219
-
220
-
221
-
222
-
223
-
224
-
225
-
226
-
227
-
228
-
229
-
230
-
231
-
232
-
233
-
234
-
235
-
236
-
237
-
238
-
239
-
240
-
241
-
242
-
243
-
244
-
245
-
246
-
247
-
248
-
249
-
250
-
251
-
252
-
253
-
254
-
255
-
256
-
257
-
258
-
259
-
260
-
261
-
262
-
263
-
264
-
265
-
266
-
267
-
268
 |
 |

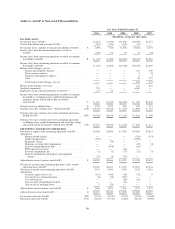
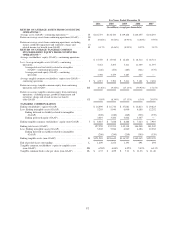
Table 2—GAAP to Non-GAAP Reconciliation
For Years Ended December 31
2011 2010 2009 2008 2007
(In millions, except per share data)
INCOME (LOSS)
Net income (loss) (GAAP) ............................... $ (215) $ (539) $(1,031) $(5,596) $1,251
Preferred dividends and accretion (GAAP) .................. (214) (224) (230) (26) —
Net income (loss) available to common shareholders (GAAP) . . . A (429) (763) (1,261) (5,622) 1,251
Income (loss) from discontinued operations, net of tax
(GAAP) ........................................... (404) (71) 43 53 (34)
Income (loss) from continuing operations available to common
shareholders (GAAP) ................................. B $ (25) $ (692) $(1,304) $(5,675) $1,285
Income (loss) from continuing operations available to common
shareholders (GAAP) ................................. $ (25) $ (692) $(1,304) $(5,675) $1,285
Merger-related charges, pre-tax:
Salaries and employee benefits ....................... — — — 134 159
Net occupancy expense ............................. — — — 4 34
Furniture and equipment expense ..................... — — — 5 5
Other ........................................... — — — 58 153
Total merger-related charges, pre-tax .................. — — — 201 351
Merger-related charges, net of tax ......................... — — — 125 219
Goodwill impairment ................................... 253 — — 6,000 —
Regulatory charge and related income tax benefit (1) ........... (17) 75 — — —
Income (loss) from continuing operations available to common
shareholders, excluding merger, goodwill impairment and
regulatory charge and related income tax benefit
(non-GAAP) ........................................ C $ 211 $ (617) $(1,304) $ 450 $1,504
Weighted-average diluted shares .......................... D 1,258 1,227 989 695 713
Earnings (loss) per common share – diluted (GAAP) .......... A/D $(0.34) $ (0.62) $ (1.27) $ (8.09) $ 1.75
Earnings (loss) per common share from continuing operations –
diluted (GAAP) ..................................... B/D $(0.02) $ (0.56) $ (1.32) $ (8.16) $ 1.80
Earnings (loss) per common share from continuing operations,
excluding merger, goodwill impairment and regulatory charge
and related income tax benefit—diluted (non-GAAP) ....... C/D $ 0.17 $ (0.50) $ (1.32) $ 0.65 $ 2.11
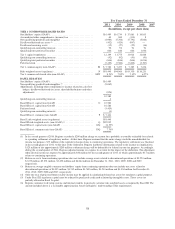
EFFICIENCY AND FEE INCOME RATIOS
Non-interest expense from continuing operations (GAAP) ...... $3,862 $3,859 $ 3,785 $ 9,895 $3,821
Adjustments:
Merger-related charges ............................. — — — (201) (351)
Goodwill impairment ............................... (253) — — (6,000) —
Regulatory charge ................................. — (75) — — —
Mortgage servicing rights impairment .................. — — — (85) (6)
Loss on extinguishment of debt ....................... — (108) — (66) —
FDIC special assessment ............................ — — (64) — —
Securities impairment, net ........................... (2) (2) (75) (23) (7)
Branch consolidation and property and equipment
charges ........................................ (75) (8) (53) — —
Adjusted non-interest expense (non-GAAP) ................. E $3,532 $3,666 $ 3,593 $ 3,520 $3,457
Net interest income from continuing operations, fully- taxable
equivalent basis (GAAP) .............................. $3,445 $3,421 $ 3,325 $ 3,825 $4,364
Non-interest income from continuing operations (GAAP) ...... 2,143 2,489 2,765 2,132 1,918
Adjustments:
Securities (gains) losses, net ......................... (112) (394) (69) (92) 9
Leveraged lease termination gains ..................... (8) (78) (587) — —
Visa-related gains .................................. — — (80) (63) —
Gain on early extinguishment of debt .................. — — (61) — —
Gain on sale of mortgage loans ....................... 3 (26) — — —
Adjusted non-interest income (non-GAAP) ................. F 2,026 1,991 1,968 1,977 1,927
Adjusted total revenue (non-GAAP) ....................... G $5,471 $5,412 $ 5,293 $ 5,802 $6,291
Fee income ratio (non-GAAP) ............................ F/G 37.03% 36.79% 37.18% 34.07% 30.63%
Efficiency ratio (non-GAAP) ............................. E/G 64.56% 67.74% 67.88% 60.67% 54.95%
56