Regions Bank 2011 Annual Report Download - page 115
Download and view the complete annual report
Please find page 115 of the 2011 Regions Bank annual report below. You can navigate through the pages in the report by either clicking on the pages listed below, or by using the keyword search tool below to find specific information within the annual report.-
 1
1 -
2
-
3
-
4
-
5
-
6
-
7
-
8
-
9
-
10
-
11
-
12
-
13
-
14
-
15
-
16
-
17
-
18
-
19
-
20
-
21
-
22
-
23
-
24
-
25
-
26
-
27
-
28
-
29
-
30
-
31
-
32
-
33
-
34
-
35
-
36
-
37
-
38
-
39
-
40
-
41
-
42
-
43
-
44
-
45
-
46
-
47
-
48
-
49
-
50
-
51
-
52
-
53
-
54
-
55
-
56
-
57
-
58
-
59
-
60
-
61
-
62
-
63
-
64
-
65
-
66
-
67
-
68
-
69
-
70
-
71
-
72
-
73
-
74
-
75
-
76
-
77
-
78
-
79
-
80
-
81
-
82
-
83
-
84
-
85
-
86
-
87
-
88
-
89
-
90
-
91
-
92
-
93
-
94
-
95
-
96
-
97
-
98
-
99
-
100
-
101
-
102
-
103
-
104
-
 105
105 -
 106
106 -
 107
107 -
 108
108 -
 109
109 -
 110
110 -
 111
111 -
 112
112 -
 113
113 -
 114
114 -
 115
115 -
 116
116 -
 117
117 -
 118
118 -
 119
119 -
 120
120 -
 121
121 -
 122
122 -
 123
123 -
 124
124 -
 125
125 -
126
-
127
-
128
-
129
-
130
-
131
-
132
-
133
-
134
-
135
-
136
-
137
-
138
-
139
-
140
-
141
-
142
-
143
-
144
-
145
-
146
-
147
-
148
-
149
-
150
-
151
-
152
-
153
-
154
-
155
-
156
-
157
-
158
-
159
-
160
-
161
-
162
-
163
-
164
-
165
-
166
-
167
-
168
-
169
-
170
-
171
-
172
-
173
-
174
-
175
-
176
-
177
-
178
-
179
-
180
-
181
-
182
-
183
-
184
-
185
-
186
-
187
-
188
-
189
-
190
-
191
-
192
-
193
-
194
-
195
-
196
-
197
-
198
-
199
-
200
-
201
-
202
-
203
-
204
-
205
-
206
-
207
-
208
-
209
-
210
-
211
-
212
-
213
-
214
-
215
-
216
-
217
-
218
-
219
-
220
-
221
-
222
-
223
-
224
-
225
-
226
-
227
-
228
-
229
-
230
-
231
-
232
-
233
-
234
-
235
-
236
-
237
-
238
-
239
-
240
-
241
-
242
-
243
-
244
-
245
-
246
-
247
-
248
-
249
-
250
-
251
-
252
-
253
-
254
-
255
-
256
-
257
-
258
-
259
-
260
-
261
-
262
-
263
-
264
-
265
-
266
-
267
-
268
 |
 |

Based on current expectations for the economy, management anticipates that net loan charge-offs will
decrease in 2012, but continue at an elevated level for the near future. Economic trends such as real estate
valuations, interest rates and unemployment will impact the future levels of net charge-offs and provision for
loan losses.
Regions recorded an allowance for loan losses and related premium of approximately $84 million related to
its purchase of credit card accounts during the second quarter of 2011. In the fourth quarter of 2011, Regions
reclassified the $84 million allowance and premium as an adjustment to the basis of the loans. The impact of
these reclassification entries was not material to the consolidated financial statements.
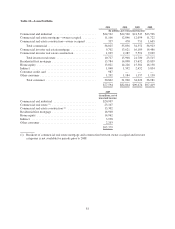
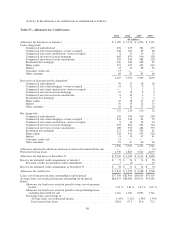
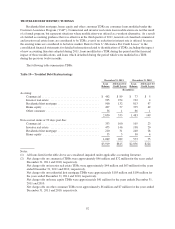
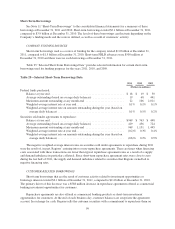
Table 18—Allocation of the Allowance for Loan Losses
2011 2010 2009 2008
Allocation
Amount
%of
Total
Allocation
Amount
%of
Total
Allocation
Amount
%of
Total
Amount
Allocation
%of
Total
(Dollars in millions)
Commercial and industrial ....... $ 586 21.3% $ 641 20.1% $ 638 20.5% $ 466 25.5%
Commercial real estate mortgage—
owner-occupied .............. 427 15.6 395 12.4 328 10.5 172 9.4
Commercial real estate
construction—owner-occupied . . 17 0.6 19 0.6 37 1.2 48 2.6
Total commercial .......... 1,030 37.5 1,055 33.1 1,003 32.2 686 37.5
Commercial investor real estate
mortgage ................... 784 28.6 1,030 32.3 929 29.8 403 22.1
Commercial investor real estate
construction ................. 207 7.5 340 10.7 536 17.2 369 20.2
Total investor real estate ..... 991 36.1 1,370 43.0 1,465 47.0 772 42.3
Residential first mortgage ........ 282 10.3 295 9.3 213 6.9 87 4.8
Home equity .................. 356 13.0 414 13.0 374 12.0 235 12.9
Indirect ...................... 17 0.6 17 0.5 26 0.8 28 1.5
Consumer credit card ........... 37 1.3 — — — — — —
Other consumer ................ 32 1.2 34 1.1 33 1.1 18 1.0
$2,745 100.0% $3,185 100.0% $3,114 100.0% $1,826 100.0%
2007
Allocation
Amount
%of
Total
(Dollars in millions)
Commercial and industrial ....... $ 295 22.3%
Commercial real estate (1) ........ 411 31.1
Construction (1) ................ 348 26.4
Residential first mortgage ........ 89 6.7
Home equity .................. 95 7.2
Indirect ...................... 52 3.9
Other consumer ................ 31 2.4
$1,321 100.0%
(1) Breakout of commercial real estate mortgage and construction between owner-occupied and investor
categories is not available for periods prior to 2008.
91