Regions Bank 2011 Annual Report Download - page 113
Download and view the complete annual report
Please find page 113 of the 2011 Regions Bank annual report below. You can navigate through the pages in the report by either clicking on the pages listed below, or by using the keyword search tool below to find specific information within the annual report.-
 1
1 -
2
-
3
-
4
-
5
-
6
-
7
-
8
-
9
-
10
-
11
-
12
-
13
-
14
-
15
-
16
-
17
-
18
-
19
-
20
-
21
-
22
-
23
-
24
-
25
-
26
-
27
-
28
-
29
-
30
-
31
-
32
-
33
-
34
-
35
-
36
-
37
-
38
-
39
-
40
-
41
-
42
-
43
-
44
-
45
-
46
-
47
-
48
-
49
-
50
-
51
-
52
-
53
-
54
-
55
-
56
-
57
-
58
-
59
-
60
-
61
-
62
-
63
-
64
-
65
-
66
-
67
-
68
-
69
-
70
-
71
-
72
-
73
-
74
-
75
-
76
-
77
-
78
-
79
-
80
-
81
-
82
-
83
-
84
-
85
-
86
-
87
-
88
-
89
-
90
-
91
-
92
-
93
-
94
-
95
-
96
-
97
-
98
-
99
-
100
-
101
-
102
-
 103
103 -
 104
104 -
 105
105 -
 106
106 -
 107
107 -
 108
108 -
 109
109 -
 110
110 -
 111
111 -
 112
112 -
 113
113 -
 114
114 -
 115
115 -
 116
116 -
 117
117 -
 118
118 -
 119
119 -
 120
120 -
 121
121 -
 122
122 -
 123
123 -
124
-
125
-
126
-
127
-
128
-
129
-
130
-
131
-
132
-
133
-
134
-
135
-
136
-
137
-
138
-
139
-
140
-
141
-
142
-
143
-
144
-
145
-
146
-
147
-
148
-
149
-
150
-
151
-
152
-
153
-
154
-
155
-
156
-
157
-
158
-
159
-
160
-
161
-
162
-
163
-
164
-
165
-
166
-
167
-
168
-
169
-
170
-
171
-
172
-
173
-
174
-
175
-
176
-
177
-
178
-
179
-
180
-
181
-
182
-
183
-
184
-
185
-
186
-
187
-
188
-
189
-
190
-
191
-
192
-
193
-
194
-
195
-
196
-
197
-
198
-
199
-
200
-
201
-
202
-
203
-
204
-
205
-
206
-
207
-
208
-
209
-
210
-
211
-
212
-
213
-
214
-
215
-
216
-
217
-
218
-
219
-
220
-
221
-
222
-
223
-
224
-
225
-
226
-
227
-
228
-
229
-
230
-
231
-
232
-
233
-
234
-
235
-
236
-
237
-
238
-
239
-
240
-
241
-
242
-
243
-
244
-
245
-
246
-
247
-
248
-
249
-
250
-
251
-
252
-
253
-
254
-
255
-
256
-
257
-
258
-
259
-
260
-
261
-
262
-
263
-
264
-
265
-
266
-
267
-
268
 |
 |

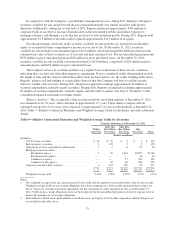
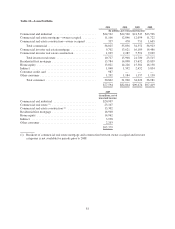
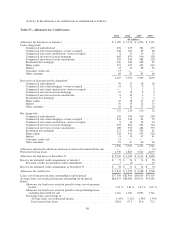
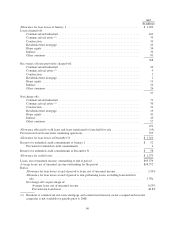
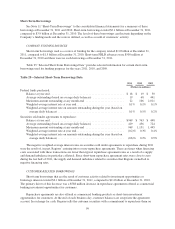
Activity in the allowance for credit losses is summarized as follows:
Table 17—Allowance for Credit Losses
2011 2010 2009 2008
(In millions)
Allowance for loan losses at January 1 .................................. $ 3,185 $ 3,114 $ 1,826 $ 1,321
Loans charged-off:
Commercial and industrial ........................................ 294 429 384 235
Commercial real estate mortgage—owner-occupied .................... 248 225 89 60
Commercial real estate construction—owner-occupied ................. 8 25 19 12
Commercial investor real estate mortgage ............................ 685 879 590 328
Commercial investor real estate construction ......................... 195 565 488 556
Residential first mortgage ......................................... 220 240 206 83
Home equity ................................................... 353 432 442 243
Indirect ....................................................... 23 34 68 56
Consumer credit card ............................................ 13 — — —
Other consumer ................................................ 68 83 83 66
2,107 2,912 2,369 1,639
Recoveries of loans previously charged-off:
Commercial and industrial ........................................ 36 33 28 26
Commercial real estate mortgage—owner-occupied .................... 14 11 6 5
Commercial real estate construction—owner-occupied ................. — 1 1 2
Commercial investor real estate mortgage ............................ 27 14 8 4
Commercial investor real estate construction ......................... 6 10 4 3
Residential first mortgage ......................................... 3242
Home equity ................................................... 25 18 27 17
Indirect ....................................................... 10 15 21 15
Other consumer ................................................ 16 16 17 18
137 120 116 92
Net charge-offs:
Commercial and industrial ........................................ 258 396 356 209
Commercial real estate mortgage—owner-occupied .................... 234 214 83 55
Commercial real estate construction—owner-occupied ................. 8 24 18 10
Commercial investor real estate mortgage ............................ 658 865 582 324
Commercial investor real estate construction ......................... 189 555 484 553
Residential first mortgage ......................................... 217 238 202 81
Home equity ................................................... 328 414 415 226
Indirect ....................................................... 13 19 47 41
Consumer credit card ............................................ 13 — — —
Other consumer ................................................ 52 67 66 48
1,970 2,792 2,253 1,547
Allowance allocated to sold loans and loans transferred to loans held for sale .... — — — (5)
Provision for loan losses .............................................. 1,530 2,863 3,541 2,057
Allowance for loan losses at December 31 ............................... $ 2,745 $ 3,185 $ 3,114 $ 1,826
Reserve for unfunded credit commitments at January 1 ..................... $ 71 $ 74 $ 74 $ 58
Provision (credit) for unfunded credit commitments .................... 7 (3) — 16
Reserve for unfunded credit commitments at December 31 .................. $ 78 $ 71 $ 74 $ 74
Allowance for credit losses ........................................... $ 2,823 $ 3,256 $ 3,188 $ 1,900
Loans, net of unearned income, outstanding at end of period $77,594 $82,864 $90,674 $97,419
Average loans, net of unearned income outstanding for the period $80,673 $86,660 $94,523 $97,601
Ratios:
Allowance for loan losses at end of period to loans, net of unearned
income ..................................................... 3.54 % 3.84 % 3.43 % 1.87 %
Allowance for loan losses at end of period to non-performing loans,
excluding loans held for sale .................................... 1.16x 1.01x 0.89x 1.74x
Net charge-offs as percentage of: ...................................
Average loans, net of unearned income .......................... 2.44% 3.22% 2.38% 1.59%
Provision for loan losses ...................................... 128.8 97.5 63.6 75.2
89