Regions Bank 2011 Annual Report Download - page 207
Download and view the complete annual report
Please find page 207 of the 2011 Regions Bank annual report below. You can navigate through the pages in the report by either clicking on the pages listed below, or by using the keyword search tool below to find specific information within the annual report.-
 1
1 -
2
-
3
-
4
-
5
-
6
-
7
-
8
-
9
-
10
-
11
-
12
-
13
-
14
-
15
-
16
-
17
-
18
-
19
-
20
-
21
-
22
-
23
-
24
-
25
-
26
-
27
-
28
-
29
-
30
-
31
-
32
-
33
-
34
-
35
-
36
-
37
-
38
-
39
-
40
-
41
-
42
-
43
-
44
-
45
-
46
-
47
-
48
-
49
-
50
-
51
-
52
-
53
-
54
-
55
-
56
-
57
-
58
-
59
-
60
-
61
-
62
-
63
-
64
-
65
-
66
-
67
-
68
-
69
-
70
-
71
-
72
-
73
-
74
-
75
-
76
-
77
-
78
-
79
-
80
-
81
-
82
-
83
-
84
-
85
-
86
-
87
-
88
-
89
-
90
-
91
-
92
-
93
-
94
-
95
-
96
-
97
-
98
-
99
-
100
-
101
-
102
-
103
-
104
-
105
-
106
-
107
-
108
-
109
-
110
-
111
-
112
-
113
-
114
-
115
-
116
-
117
-
118
-
119
-
120
-
121
-
122
-
123
-
124
-
125
-
126
-
127
-
128
-
129
-
130
-
131
-
132
-
133
-
134
-
135
-
136
-
137
-
138
-
139
-
140
-
141
-
142
-
143
-
144
-
145
-
146
-
147
-
148
-
149
-
150
-
151
-
152
-
153
-
154
-
155
-
156
-
157
-
158
-
159
-
160
-
161
-
162
-
163
-
164
-
165
-
166
-
167
-
168
-
169
-
170
-
171
-
172
-
173
-
174
-
175
-
176
-
177
-
178
-
179
-
180
-
181
-
182
-
183
-
184
-
185
-
186
-
187
-
188
-
189
-
190
-
191
-
192
-
193
-
194
-
195
-
196
-
 197
197 -
 198
198 -
 199
199 -
 200
200 -
 201
201 -
 202
202 -
 203
203 -
 204
204 -
 205
205 -
 206
206 -
 207
207 -
 208
208 -
 209
209 -
 210
210 -
 211
211 -
 212
212 -
 213
213 -
 214
214 -
 215
215 -
 216
216 -
 217
217 -
218
-
219
-
220
-
221
-
222
-
223
-
224
-
225
-
226
-
227
-
228
-
229
-
230
-
231
-
232
-
233
-
234
-
235
-
236
-
237
-
238
-
239
-
240
-
241
-
242
-
243
-
244
-
245
-
246
-
247
-
248
-
249
-
250
-
251
-
252
-
253
-
254
-
255
-
256
-
257
-
258
-
259
-
260
-
261
-
262
-
263
-
264
-
265
-
266
-
267
-
268
 |
 |

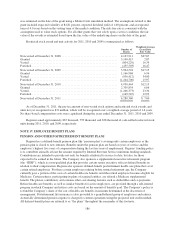
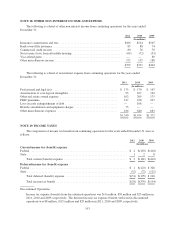
NOTE 15. EARNINGS (LOSS) PER COMMON SHARE
The following table sets forth the computation of basic earnings (loss) per common share and diluted
earnings (loss) per common share for the years ended December 31:
2011 2010 2009
(In millions, except per share amounts)
Numerator:
Income (loss) from continuing operations .............................. $ 189 $ (468) $(1,074)
Less: Preferred stock dividends and accretion ........................... (214) (224) (230)
Income (loss) from continuing operations available to common shareholders . . (25) (692) (1,304)
Income (loss) from discontinued operations, net of tax .................... (404) (71) 43
Net income (loss) available to common shareholders ..................... $ (429) $ (763) $(1,261)
Denominator:
Weighted-average common shares outstanding—basic and diluted .......... 1,258 1,227 989
Earnings (loss) per common share from continuing operations(1):
Basic ........................................................... $(0.02) $ (0.56) $ (1.32)
Diluted .......................................................... (0.02) (0.56) (1.32)
Earnings (loss) per common share from discontinued operations(1):
Basic ........................................................... (0.32) (0.06) 0.04
Diluted .......................................................... (0.32) (0.06) 0.04
Earnings (loss) per common share(1):
Basic ........................................................... (0.34) (0.62) (1.27)
Diluted .......................................................... (0.34) (0.62) (1.27)
(1) Certain per share amounts may not appear to reconcile due to rounding.
Basic and diluted weighted-average common shares outstanding for earnings per common share from
continuing operations and in total are the same for all years presented due to net losses. For earnings per common
share from discontinued operations, basic and diluted weighted-average common shares outstanding are the same
for the 2011 and 2010 periods due to net losses. For the 2009 period, diluted earnings per common share from
discontinued operations are calculated using a denominator of 1,051 million shares, which includes 62 million
potential common shares, due to net income.
As discussed in Note 14, approximately 63 million common shares were issued in June of 2010 in
connection with the conversion of the remaining Series B mandatorily convertible preferred shares, which were
originally issued in May 2009. Under applicable accounting literature, such shares should be included in the
denominator in arriving at diluted earnings per share as if they were issued at the beginning of the reporting
period or as of the date issued, if later. Prior to conversion, these shares were not included in the computation
above as such amounts would have had an antidilutive effect on earnings (loss) per common share.
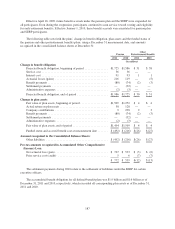
NOTE 16. SHARE-BASED PAYMENTS
Regions has long-term incentive compensation plans that permit the granting of incentive awards in the
form of stock options, restricted stock, restricted stock awards and units, and/or stock appreciation rights. While
Regions has the ability to issue stock appreciation rights, none have been issued to date. The terms of all awards
issued under these plans are determined by the Compensation Committee of the Board of Directors; however, no
awards may be granted after the tenth anniversary from the date the plans were initially approved by
shareholders. Options and restricted stock usually vest based on employee service, generally within three years
from the date of the grant. The contractual lives of options granted under these plans range from seven to ten
years from the date of the grant.
183